Material Indecision:
- In a dreadful week for overall markets where all 11 of the major S&P sectors fell, the XLB could take a small consolation prize for falling the least by .8%. Steel names were the biggest weight on the group with CLF off 12% and X by 9%, and the latter is trading back to the 30 number which bulls would like to see as support, with the level being former resistance twice in 2021. There was no real place to hide this week as gold miners slipped with names like NEM and RGLD falling 2.2 and 5% respectively. NEM recorded a rare double-digit WEEKLY loss 2 weeks ago, just it's second since March of 2020, and that was a red flag occurring so quickly after a strong WEEKLY cup base breakout. FCX is right back to its 200-day SMA and the area of a bullish island reversal completed with the gap up on 2/9 after the gap down on 1/21. Overall the chart below of the XLB, trying to capture a sector feel one has to proceed with caution. The WEEKLY bearish engulfing candle ending 4/22 fell almost 4% and intraweek was above a bull flag (also the 4-week tight pattern we speak of on the chart). However, as always we have to be open-minded about upside potential as well.

Chemical Reaction:
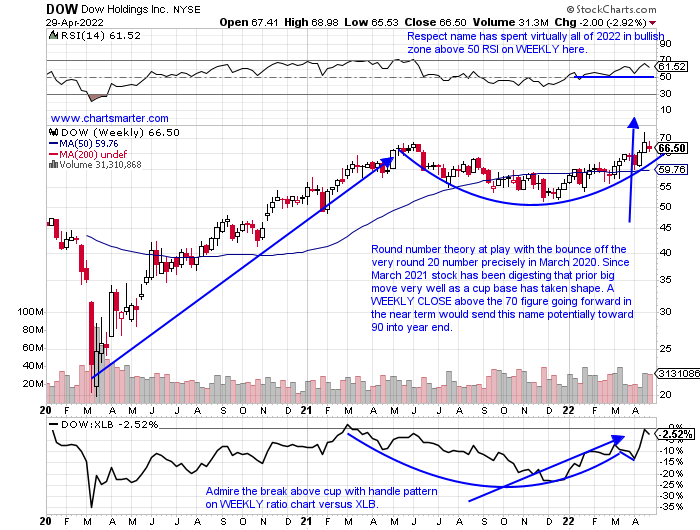
- The commodity chemicals space has seen its share of leaders and laggards. On the bullish side stocks like OLN which traveled from the very round 10 number in August 2020 to above 60 last November looks attractive. Friday recorded a nice earnings reaction up 8% but CLOSED at lows for the daily range. LYB seems to be more comfortable by the week trading above the par figure and has now CLOSED above 100 eight consecutive weeks. Each of these names are rare examples of any stocks trading above both their 50 and 200-day SMAs. On the flip side, APD is below both of those mentioned moving averages and trades 26% off highs made last November and it started 2022 with a nasty 10-week losing streak, not a typo. Below is the chart of DOW and if this can CLOSE above 70 on a WEEKLY basis in the coming weeks would be a very good sign. That would have it move above a long cup base one year in duration, and we know the phrase the "longer the base the greater the space" upon breakout.
Recent Examples:
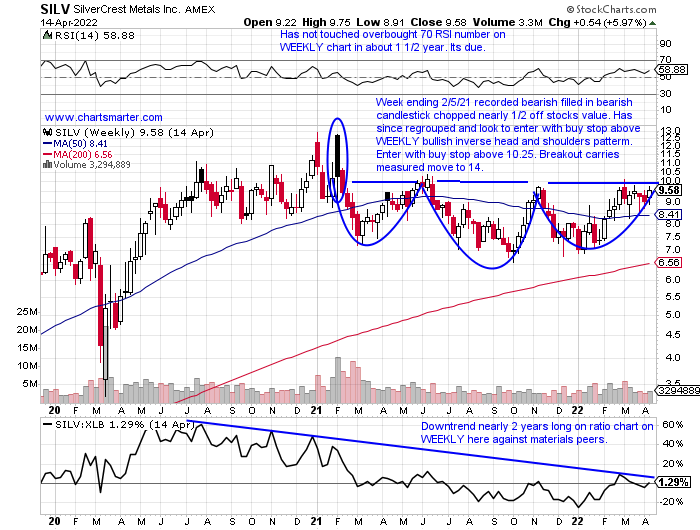
- I am a big proponent of round number theory and CLOSING PRICES, hence why those words are capitalized. Some numbers are rounder than others like 90, as most names that travel through it for the first time often trade above par and beyond. Twenty is another one as names leave teenager status. The 10 number is also very influential as a stock attempts to rid itself of single digits. Below is a good example of this with the chart of SILV and how it appeared in our 4/18 Materials Note (the last one we did on the group). One can see how the 10 number on its WEEKLY chart here was rough resistance dating back to early 2021, which was the neckline in a bullish inverse head and shoulders pattern too. It was suggested that a purchase above 10.25 made sense, but it was never able to achieve that on a WEEKLY or daily basis. The last 2 weeks alone have shaved off nearly one-quarter of its value.
Special Situations:
- Steel play higher by 17% YTD and 43% over last one-year period.
- Name 25% off most recent 52-week highs and now lower 4 of last 5 weeks. Respect a doubling in PRICE during 7 of 8 week winning streak between weeks ending 2/4-3/25.
- Earnings mostly lower down 2.1, 9.7 and .5% on 4/22, 2/11 and 7/22/21 (rose 12.7% on 10/22/21).
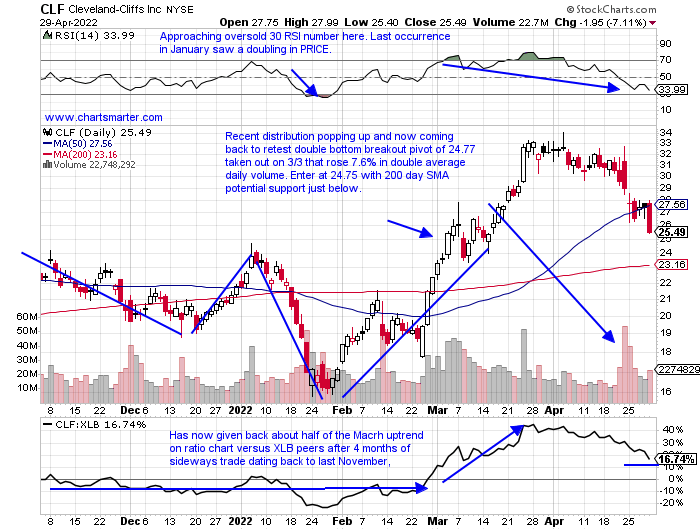
- Enter on pullback into double bottom breakout.
- Entry CLF 24.75. Stop 23.
- Aluminum play up 14% YTD and 85% over last one-year period. Dividend yield of .6%.
- Name 31% off most recent 52-week highs and last week rose .5%, good relative strength as XLB fell .8%. It fell 23% prior week and bears were unable to push stock lower. Have to go back 11 months to witness last 3-week losing streak.
- Earnings mixed with gains of 2.7 and 15.2% on 1/20 and 10/15/21 and losses of 16.9 and 4.6% on 4/21 and 7/16/21.
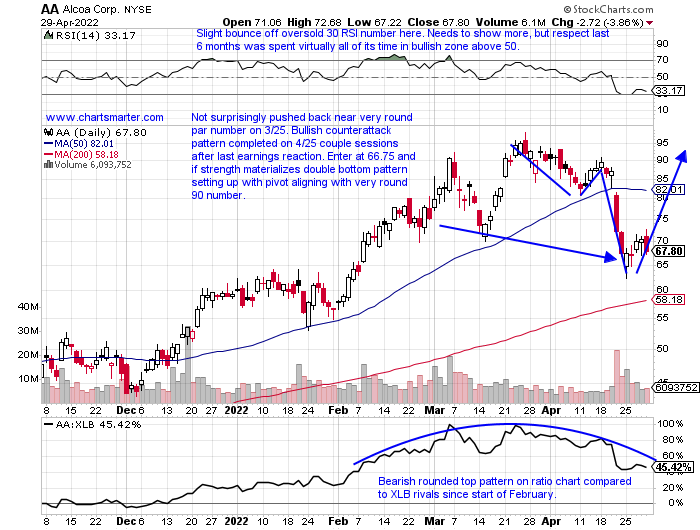
- Enter on pullback into bullish counterattack pattern.
- Entry AA 66.75. Stop 62.
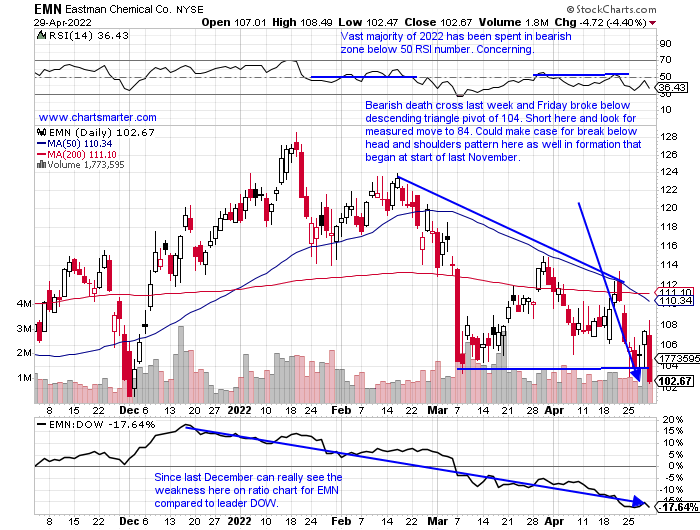
- Commodity chemicals laggard down 15% YTD and 11% over last one-year period. Dividend yield of 3%.
- Name 21% off most recent 52-week highs and lower 10 of last 15 weeks. Very round par figure was support last September-October as well with bullish engulfing candle there week ending 11/5/21. Needs to hold.
- FOUR straight negative earnings reactions down 4.6, .3, 5.5 and .1% on 4/29, 1/28, 10/29 and 8/3/21.
- Enter short after break below bearish descending triangle.
- Entry EMN here. Buy stop 108.
Good luck.
Entry summaries:
Buy pullback into double bottom breakout CLF 24.75. Stop 23.
Buy pullback into bullish counterattack pattern AA 66.75. Stop 62.
Short after break below bearish descending triangle EMN here. Buy stop 108.
This article requires a Chartsmarter membership. Please click here to join.
Material Indecision:
- In a dreadful week for overall markets where all 11 of the major S&P sectors fell, the XLB could take a small consolation prize for falling the least by .8%. Steel names were the biggest weight on the group with CLF off 12% and X by 9%, and the latter is trading back to the 30 number which bulls would like to see as support, with the level being former resistance twice in 2021. There was no real place to hide this week as gold miners slipped with names like NEM and RGLD falling 2.2 and 5% respectively. NEM recorded a rare double-digit WEEKLY loss 2 weeks ago, just it's second since March of 2020, and that was a red flag occurring so quickly after a strong WEEKLY cup base breakout. FCX is right back to its 200-day SMA and the area of a bullish island reversal completed with the gap up on 2/9 after the gap down on 1/21. Overall the chart below of the XLB, trying to capture a sector feel one has to proceed with caution. The WEEKLY bearish engulfing candle ending 4/22 fell almost 4% and intraweek was above a bull flag (also the 4-week tight pattern we speak of on the chart). However, as always we have to be open-minded about upside potential as well.
Chemical Reaction:
- The commodity chemicals space has seen its share of leaders and laggards. On the bullish side stocks like OLN which traveled from the very round 10 number in August 2020 to above 60 last November looks attractive. Friday recorded a nice earnings reaction up 8% but CLOSED at lows for the daily range. LYB seems to be more comfortable by the week trading above the par figure and has now CLOSED above 100 eight consecutive weeks. Each of these names are rare examples of any stocks trading above both their 50 and 200-day SMAs. On the flip side, APD is below both of those mentioned moving averages and trades 26% off highs made last November and it started 2022 with a nasty 10-week losing streak, not a typo. Below is the chart of DOW and if this can CLOSE above 70 on a WEEKLY basis in the coming weeks would be a very good sign. That would have it move above a long cup base one year in duration, and we know the phrase the "longer the base the greater the space" upon breakout.
Recent Examples:
- I am a big proponent of round number theory and CLOSING PRICES, hence why those words are capitalized. Some numbers are rounder than others like 90, as most names that travel through it for the first time often trade above par and beyond. Twenty is another one as names leave teenager status. The 10 number is also very influential as a stock attempts to rid itself of single digits. Below is a good example of this with the chart of SILV and how it appeared in our 4/18 Materials Note (the last one we did on the group). One can see how the 10 number on its WEEKLY chart here was rough resistance dating back to early 2021, which was the neckline in a bullish inverse head and shoulders pattern too. It was suggested that a purchase above 10.25 made sense, but it was never able to achieve that on a WEEKLY or daily basis. The last 2 weeks alone have shaved off nearly one-quarter of its value.
Special Situations:
- Steel play higher by 17% YTD and 43% over last one-year period.
- Name 25% off most recent 52-week highs and now lower 4 of last 5 weeks. Respect a doubling in PRICE during 7 of 8 week winning streak between weeks ending 2/4-3/25.
- Earnings mostly lower down 2.1, 9.7 and .5% on 4/22, 2/11 and 7/22/21 (rose 12.7% on 10/22/21).
- Enter on pullback into double bottom breakout.
- Entry CLF 24.75. Stop 23.
- Aluminum play up 14% YTD and 85% over last one-year period. Dividend yield of .6%.
- Name 31% off most recent 52-week highs and last week rose .5%, good relative strength as XLB fell .8%. It fell 23% prior week and bears were unable to push stock lower. Have to go back 11 months to witness last 3-week losing streak.
- Earnings mixed with gains of 2.7 and 15.2% on 1/20 and 10/15/21 and losses of 16.9 and 4.6% on 4/21 and 7/16/21.
- Enter on pullback into bullish counterattack pattern.
- Entry AA 66.75. Stop 62.
- Commodity chemicals laggard down 15% YTD and 11% over last one-year period. Dividend yield of 3%.
- Name 21% off most recent 52-week highs and lower 10 of last 15 weeks. Very round par figure was support last September-October as well with bullish engulfing candle there week ending 11/5/21. Needs to hold.
- FOUR straight negative earnings reactions down 4.6, .3, 5.5 and .1% on 4/29, 1/28, 10/29 and 8/3/21.
- Enter short after break below bearish descending triangle.
- Entry EMN here. Buy stop 108.
Good luck.
Entry summaries:
Buy pullback into double bottom breakout CLF 24.75. Stop 23.
Buy pullback into bullish counterattack pattern AA 66.75. Stop 62.
Short after break below bearish descending triangle EMN here. Buy stop 108.