So Bad, So Good?
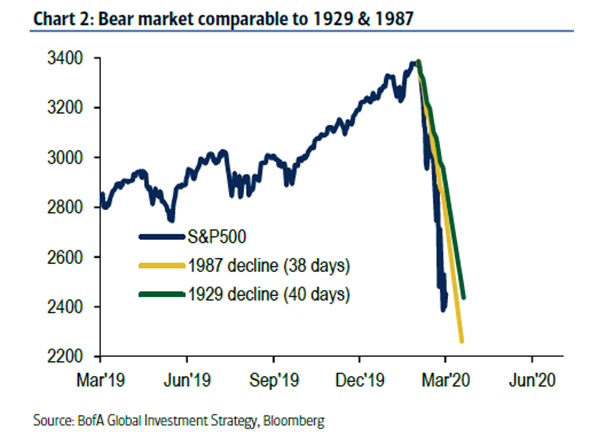
- One can write a long laundry list of the negatives associated with the current market. Today the consumer sentiment index with a record low once again touching the very round 50 number. Does round number theory give that a bounce? Of course, that is a bad stab at humor, but here is an excerpt from the University of Michigan “consumers across income, age, education, geographic region, political affiliation, stockholding, and homeownership status all posted large declines. About 79% of consumers expected bad times in the year ahead for business conditions, the highest since 2009.” Inflation, although it feels might be easing, is still prevalent. PMIs are on the descent but at the end of the day most people equate their worth with their portfolios, and the main reason they are feeling gloomy is the market action. Below is the chart comparing the depth and velocity of the current decline to two of the worst drawdowns on record. Are things so gloomy that in a contrarian stance they could be bullish?
Do Not Confuse The Bottom Of A Chart With Support:
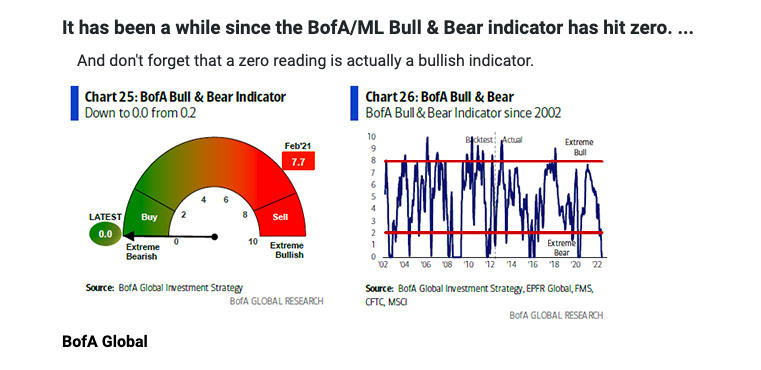
- That is a phrase I learned from my friend David Keller over the years and the chart below emphasizes that perfectly. As one can see the Bull & Bear Indicator hit zero, a level it has hit just 4 times in the last 10 years. It can not travel under zero as crude did in April 2020, but this is as extreme as it gets. On 6/16 the S&P 500 touched 3639 and as Jason Geopfert put it in that session more than 90% of stocks in the S&P 500 declined today. It's the 5th time in the past 7 days. Since 1928, there have been exactly 0 precedents. This is the most overwhelming display of selling in history (so bad, so good?). The index has rallied nearly 300 handles off those intraday lows recording a bullish island reversal like the Dow and Nasdaq. The former did so right off the very round 30000 number, and the S&P 500 and Nasdaq look on their own collision courses to 4000 and 12000 respectively which would roughly test their downward sloping 50-day SMAs.
Dalio's Big Bet:
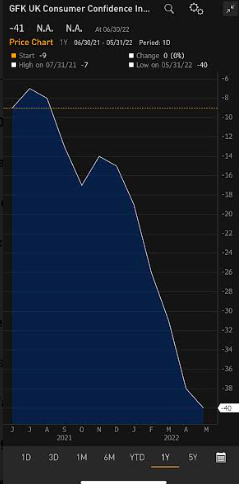
- This week it was reported that Ray "doubled down" on his European shorts. Below is the chart of the UK Consumer Confidence this week which also touched a record low. The names he shorted include some energy and semiconductors which I could agree with as they have been weak spots as of late more so than other groups. ASML was one of the listed names he bet against and Friday it recorded a bullish island reversal, and so far the stock is higher just 8 weeks in 2022. Energy concerns are most likely his reason for the bearish stance and TTE is another short position. For the last 6 months, it has been trading roughly between the round 50-60 numbers. Germany which is at the heart of the "gas crisis" is part of the short thesis. SAP is battling with the very round par number here and DB recorded some awful relative weakness falling almost 5% as the EUFN rose 3%. As Byron Wein once stated, "disasters have a way of not happening". So bad, so good?
Rotten Wood?
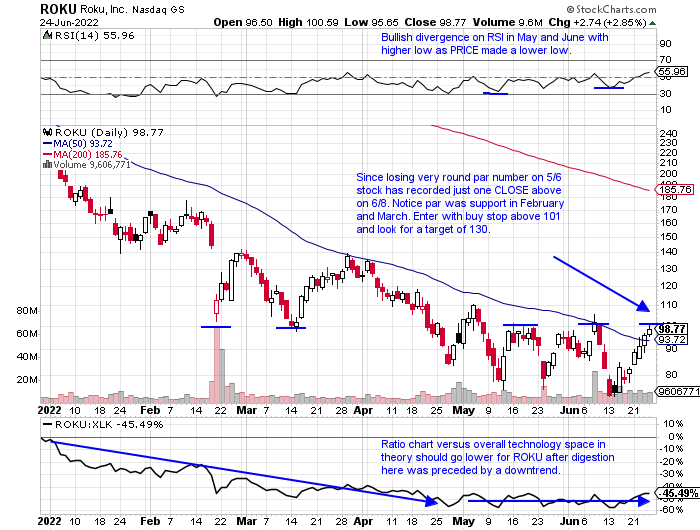
- Keeping up with our theme of so bad, so good, even Cathie Woods funds are looking ok. ARKK rose 18% this week, and although that type of frantic action is often associated with bear market bounces some of her plays are acting well (SARK lost 16% this week, but has yet to record back-to-back WEEKLY losses in 2022). ZM, the largest component in the fund, jumped 11.5% this week after the prior 4 weeks all CLOSED very taut within just 1.35 of each other. That type of tight consolidation can often lead to explosive moves. Her second-largest holding is the chart below of ROKU and the stock screamed higher by 20% this week. The last 3 WEEKLY advancers all CLOSED at the top of the range, and the weeks ending 5/13 and 5/27, both CLOSED nearly 30% off intraweek lows. The tug of war is real in this area. In fact, the WEEKLY chart has recorded 10 consecutive CLOSES below 100, with 6 of those 10 above par intraweek.
Weighing The Evidence:
- Bottoms are a process and only known truly in hindsight. A true trend change would be to see the slope of the 200-day SMA start to curl higher, although PRICE could have already gained 10-20% from then off the lows. For more conservative investors who want to avoid the daily chop, that is probably the best stance to take. But looking for clues as to when taking a position in a good risk/reward situation, Friday may have offered that. The chart of the Nasdaq below completed a bullish island reversal to end the week in very robust volume as well (the next best thing to a huge down opening a big green close is to have a strong gap and hold it throughout the day and to CLOSE strong heading into a weekend). In fact, the tech-heavy benchmark registered two-gap ups this week, one on Tuesday as well. As far as the island itself, multi-day patterns tend to work better than single-session ones do. Leadership this week was somewhat suspect this week with staples on a few occasions this week, but overall the XLK rose more than 7%, the fourth-best major S&P sector of 11. Look for that to improve further if this rally is to expand in the near term.
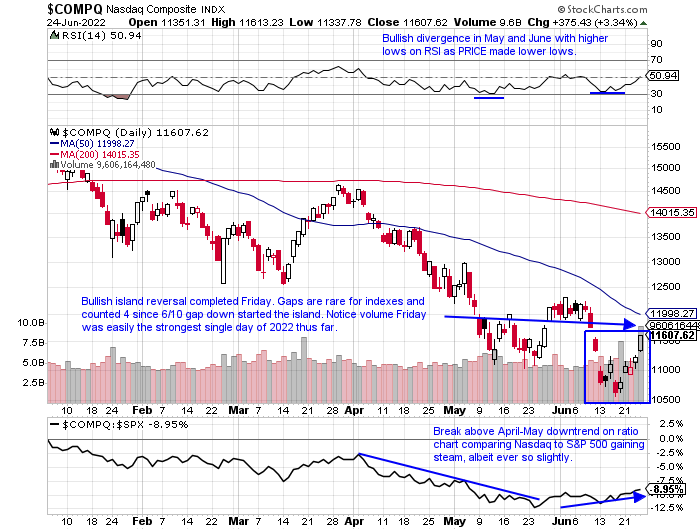
Software Acting Anything But "Soft":
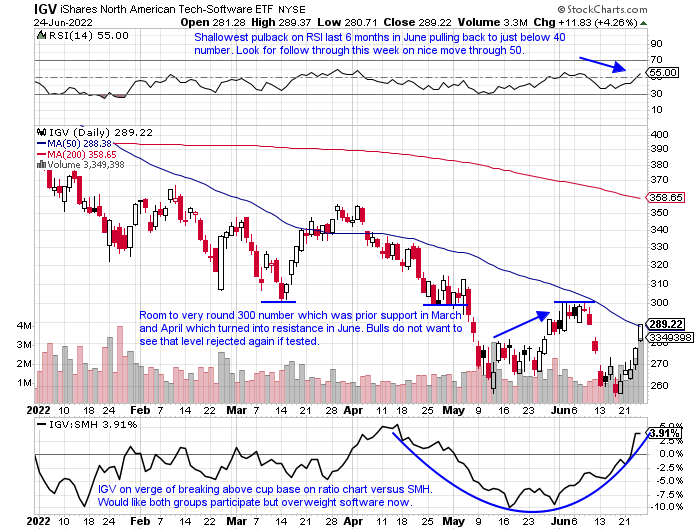
- Of course, that is relatively speaking. We know for this nascent move off the "possible" bottom here to flourish is for technology to participate. The big components of the group are obviously software and semiconductors. The former is making a push for "leadership" between the two, with the last 4 weeks seeing the IGV outperform the SMH. That started with the week ending 6/3 witnessing a gain of .7%, while the SMH fell 1.6%. The next two weeks saw the IGV lose a combined 11%, better than the SMH dropping 15.5%, but the most significant may have been last week with the IGV doubling the advance of the SMH with a jump of 10.3%. M&A activity in the space in 2022 adds to the bullish thesis as value is perceived. That includes SAIL PLAN and of course the big one in January with ATVI. Friday another one was swallowed in ZEN up handsomely by nearly 30%. Let us see if we can identify some names that have the potential to outperform going forward.
Far East Exposure:
- Chinese software play up 22% YTD and lower by 69% over last one-year period.
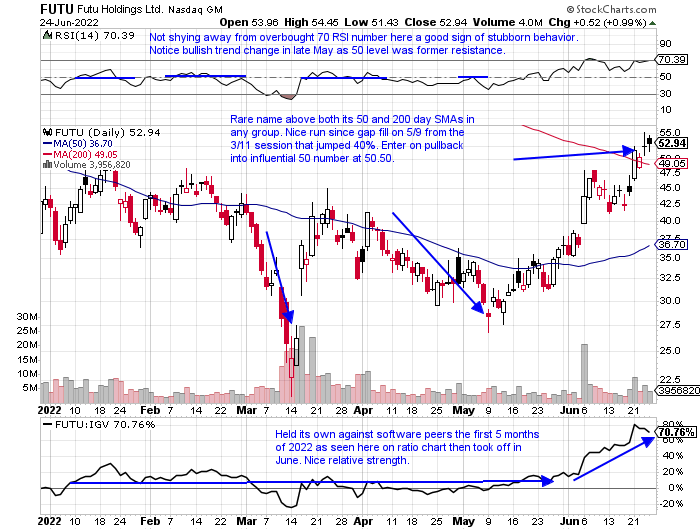
- Name 71% off most recent 52-week highs and has advanced a very impressive 6 of the last 7 weeks. Very round 50 number was influential as resistance in November '20 and this January (stopped at 200 figure in February '21).
- Earnings mostly higher up 18.6, .3, and 14.9% on 6/6, 11/24, and 9/1/21 (fell 8.8% on 3/11).
- Enter on pullback into very round number/200-day SMA.
- Entry FUTU 50.50. Stop 47.50.
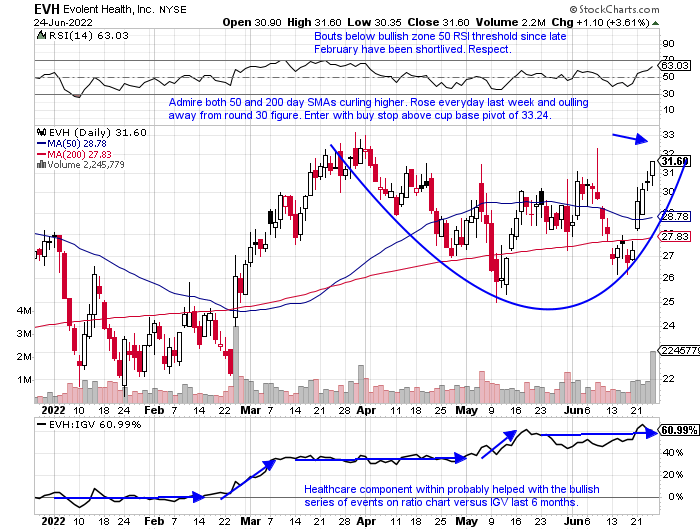
- Healthcare software play up 14% YTD and 47% over last one-year period.
- Name 9% off all-time highs. Last week rose 15.7% in 2nd best WEEKLY volume in 8 months. CLOSE above round 30 number significant as 6 weeks ending between 4/22-6/10 were all above 30 intraweek but zero CLOSED above 30.
- Three straight positive earnings reactions up 17.4, 4.8, and 5.2% on 2/24, 11/4, and 8/5/21 before recent gain of .7% on 5/5.
- Enter with buy stop above cup base pivot.
- Entry EVH 33.24. Stop 29.75.
Good luck.
This article requires a Chartsmarter membership. Please click here to join.
So Bad, So Good?
- One can write a long laundry list of the negatives associated with the current market. Today the consumer sentiment index with a record low once again touching the very round 50 number. Does round number theory give that a bounce? Of course, that is a bad stab at humor, but here is an excerpt from the University of Michigan “consumers across income, age, education, geographic region, political affiliation, stockholding, and homeownership status all posted large declines. About 79% of consumers expected bad times in the year ahead for business conditions, the highest since 2009.” Inflation, although it feels might be easing, is still prevalent. PMIs are on the descent but at the end of the day most people equate their worth with their portfolios, and the main reason they are feeling gloomy is the market action. Below is the chart comparing the depth and velocity of the current decline to two of the worst drawdowns on record. Are things so gloomy that in a contrarian stance they could be bullish?
Do Not Confuse The Bottom Of A Chart With Support:
- That is a phrase I learned from my friend David Keller over the years and the chart below emphasizes that perfectly. As one can see the Bull & Bear Indicator hit zero, a level it has hit just 4 times in the last 10 years. It can not travel under zero as crude did in April 2020, but this is as extreme as it gets. On 6/16 the S&P 500 touched 3639 and as Jason Geopfert put it in that session more than 90% of stocks in the S&P 500 declined today. It's the 5th time in the past 7 days. Since 1928, there have been exactly 0 precedents. This is the most overwhelming display of selling in history (so bad, so good?). The index has rallied nearly 300 handles off those intraday lows recording a bullish island reversal like the Dow and Nasdaq. The former did so right off the very round 30000 number, and the S&P 500 and Nasdaq look on their own collision courses to 4000 and 12000 respectively which would roughly test their downward sloping 50-day SMAs.
Dalio's Big Bet:
- This week it was reported that Ray "doubled down" on his European shorts. Below is the chart of the UK Consumer Confidence this week which also touched a record low. The names he shorted include some energy and semiconductors which I could agree with as they have been weak spots as of late more so than other groups. ASML was one of the listed names he bet against and Friday it recorded a bullish island reversal, and so far the stock is higher just 8 weeks in 2022. Energy concerns are most likely his reason for the bearish stance and TTE is another short position. For the last 6 months, it has been trading roughly between the round 50-60 numbers. Germany which is at the heart of the "gas crisis" is part of the short thesis. SAP is battling with the very round par number here and DB recorded some awful relative weakness falling almost 5% as the EUFN rose 3%. As Byron Wein once stated, "disasters have a way of not happening". So bad, so good?
Rotten Wood?
- Keeping up with our theme of so bad, so good, even Cathie Woods funds are looking ok. ARKK rose 18% this week, and although that type of frantic action is often associated with bear market bounces some of her plays are acting well (SARK lost 16% this week, but has yet to record back-to-back WEEKLY losses in 2022). ZM, the largest component in the fund, jumped 11.5% this week after the prior 4 weeks all CLOSED very taut within just 1.35 of each other. That type of tight consolidation can often lead to explosive moves. Her second-largest holding is the chart below of ROKU and the stock screamed higher by 20% this week. The last 3 WEEKLY advancers all CLOSED at the top of the range, and the weeks ending 5/13 and 5/27, both CLOSED nearly 30% off intraweek lows. The tug of war is real in this area. In fact, the WEEKLY chart has recorded 10 consecutive CLOSES below 100, with 6 of those 10 above par intraweek.
Weighing The Evidence:
- Bottoms are a process and only known truly in hindsight. A true trend change would be to see the slope of the 200-day SMA start to curl higher, although PRICE could have already gained 10-20% from then off the lows. For more conservative investors who want to avoid the daily chop, that is probably the best stance to take. But looking for clues as to when taking a position in a good risk/reward situation, Friday may have offered that. The chart of the Nasdaq below completed a bullish island reversal to end the week in very robust volume as well (the next best thing to a huge down opening a big green close is to have a strong gap and hold it throughout the day and to CLOSE strong heading into a weekend). In fact, the tech-heavy benchmark registered two-gap ups this week, one on Tuesday as well. As far as the island itself, multi-day patterns tend to work better than single-session ones do. Leadership this week was somewhat suspect this week with staples on a few occasions this week, but overall the XLK rose more than 7%, the fourth-best major S&P sector of 11. Look for that to improve further if this rally is to expand in the near term.
Software Acting Anything But "Soft":
- Of course, that is relatively speaking. We know for this nascent move off the "possible" bottom here to flourish is for technology to participate. The big components of the group are obviously software and semiconductors. The former is making a push for "leadership" between the two, with the last 4 weeks seeing the IGV outperform the SMH. That started with the week ending 6/3 witnessing a gain of .7%, while the SMH fell 1.6%. The next two weeks saw the IGV lose a combined 11%, better than the SMH dropping 15.5%, but the most significant may have been last week with the IGV doubling the advance of the SMH with a jump of 10.3%. M&A activity in the space in 2022 adds to the bullish thesis as value is perceived. That includes SAIL PLAN and of course the big one in January with ATVI. Friday another one was swallowed in ZEN up handsomely by nearly 30%. Let us see if we can identify some names that have the potential to outperform going forward.
Far East Exposure:
- Chinese software play up 22% YTD and lower by 69% over last one-year period.
- Name 71% off most recent 52-week highs and has advanced a very impressive 6 of the last 7 weeks. Very round 50 number was influential as resistance in November '20 and this January (stopped at 200 figure in February '21).
- Earnings mostly higher up 18.6, .3, and 14.9% on 6/6, 11/24, and 9/1/21 (fell 8.8% on 3/11).
- Enter on pullback into very round number/200-day SMA.
- Entry FUTU 50.50. Stop 47.50.
- Healthcare software play up 14% YTD and 47% over last one-year period.
- Name 9% off all-time highs. Last week rose 15.7% in 2nd best WEEKLY volume in 8 months. CLOSE above round 30 number significant as 6 weeks ending between 4/22-6/10 were all above 30 intraweek but zero CLOSED above 30.
- Three straight positive earnings reactions up 17.4, 4.8, and 5.2% on 2/24, 11/4, and 8/5/21 before recent gain of .7% on 5/5.
- Enter with buy stop above cup base pivot.
- Entry EVH 33.24. Stop 29.75.
Good luck.