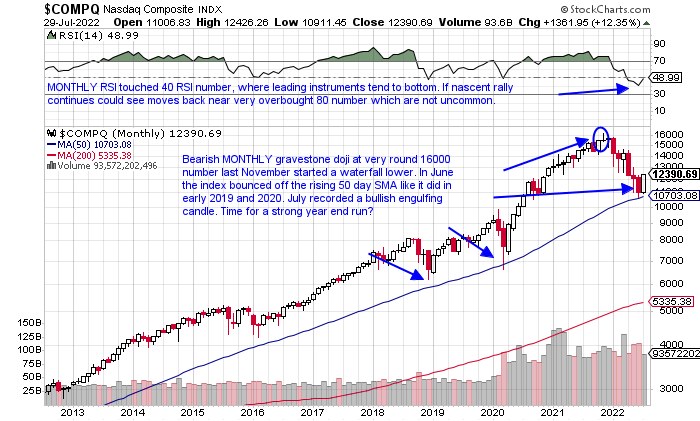
Tech Rebound:
- Things tend to look best at the top and gloomiest at the bottom. While nothing is sure, the Nasdaq completed a very strong MONTHLY candle Friday, and notice on the chart below the last 2 times that happened in January 2019 the tech-heavy index rallied for 3 consecutive months and 10 of the next 12 months. And even more impressive following the April 2020 precedent it advanced 15 of the next 19 months. The similarities exist as the month of January 2019 jumped 11.9%, the month of April 2020 screamed higher by 19.2%, and July powered ahead by 12.6% (in the last decade there have been four total double-digit MONTHLY Nasdaq advances). Notice as well during each of these months volume was not robust, as at the start of rebounds belief is at a minimum. With the mega caps earnings now in the rearview mirror after last week, one may ask what the catalyst now is. There does not have to be one, but perhaps the market is looking months forward as it normally does to the mid-term elections in November.
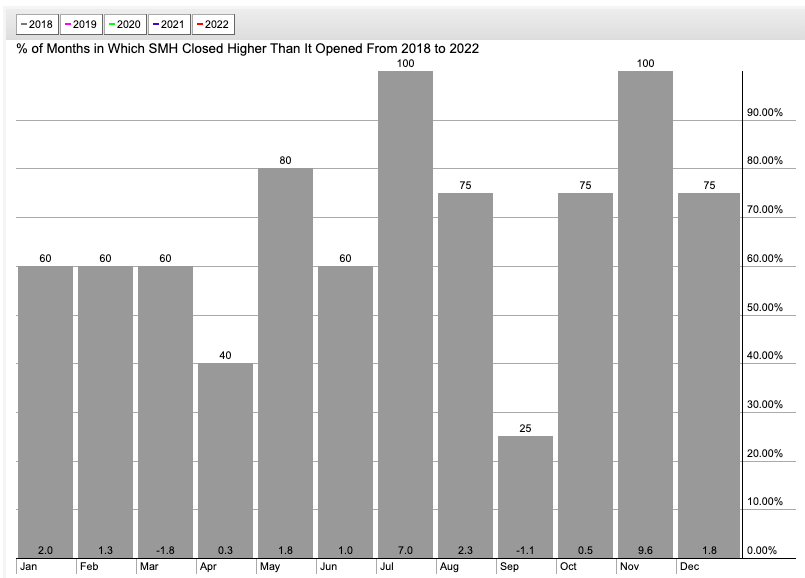
Semi Surge:
- If technology is going to lead going forward, semiconductors will have to do much of the heavy lifting. Below this seasonality chart of the SMH July happens to be one of the best months as it has risen all 5 times since 2018. And look at the number on the bottom of the column that shows an average MONTHLY return of 7% during the time period. Of course, that is noteworthy, but if one glances right to November that has gained the last 4 years 100% of the time and by a whopping average of 9.6%. It is easy to see that Q4 is the firmest since 2018, and from a seasonality perspective, the semis should simply consolidate their gains in August and September with traditional mediocre returns. That would be a prudent pause, but remember if one is to produce alpha some will gain much more than peers. In that respect, let us take a look at a few that have been acting well already, as they are likely to continue to outperform.
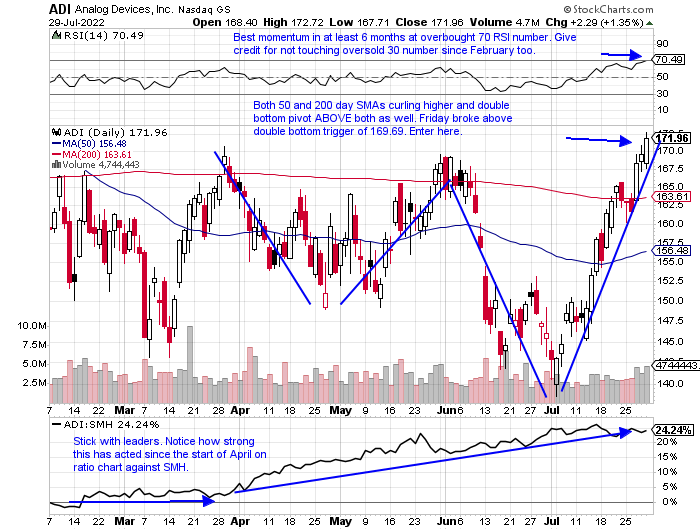
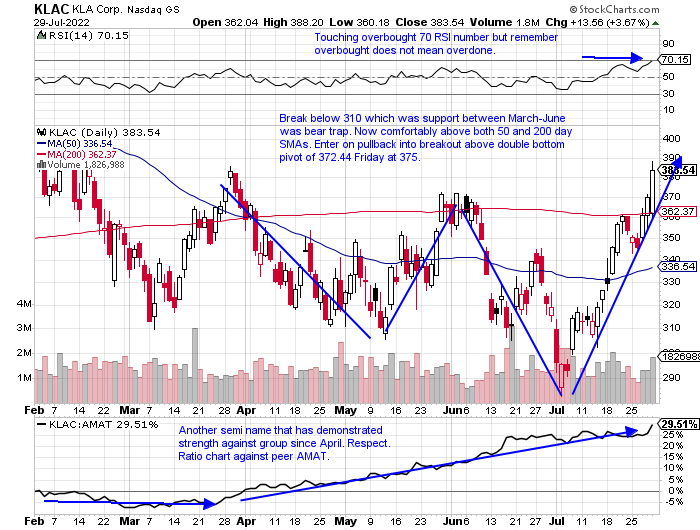
Semi Lookers:
- Semiconductor play down 2% YTD and higher by 3% over last one year period. Dividend yield of 1.8%.
- Name 10% off most recent 52-week highs (AMD 43% off its annual peak) and has broken lower highs from late May-early June on this current 4-week winning streak that gained a combined 19%.
- Earnings mostly lower off 2.4, 1.6 and .3% on 5/18, 11/23 and 8/18/21 (rose 3.9% on 2/16).
- Enter after recent break above double bottom base.
- Entry ADI here. Stop 163 (REPORTS 8/17 before open).
- Semi equipment play down 11% YTD and up 20% over last one-year period. Dividend yield of 1.1%.
- Name 16% off most recent 52-week highs (NVDA 48% off its annual peak) and current 4-week winning streak up a combined 27%, and all four CLOSED at top of WEEKLY range. Now above late May-early June highs too.
- Earnings mostly higher up 3.7, 1.3, and 4.3% on 7/29, 1/28 and 10/28/21 (fell 4.1% on 4/29).
- Enter on pullback into double bottom breakout.
- Entry KLAC 375. Stop 349.
Is Energy Back?
- Perhaps the right answer is it just needed a healthy breather. Of course, on a YTD basis, it is going to take a herculean effort to overtake energy with the XLE up more than 44% in 2022 (every other major S&P sector is lower this year so far except the XLU). But this week the group was the best performing group as the XLE gained more than 10%, its third double-digit WEEKLY advance. This was aided by both XOM and CVX reporting before the bell Friday. I still prefer the chart of XOM as it is a bit smoother as it makes its way to the very round par number for a second time and approaches a cup base pivot of 105.67. Perhaps the best it can do is pause here and form a handle on this potential base. My favorite name continues to be OXY, which Warren has a sizable position in, and it never really came into close proximity to its 200-day SMA like most others, recording much smaller drawdowns. Do not sleep on the services names as they may play catch up with the OIH rising 14.6% last week. Thought this was an interesting article on the subject.
Dollar Implications:
- Market participants have been watching the US Dollar closely to determine which way the averages will move. It is no coincidence that the market has rallied as the dollar fell 9 of the last 11 sessions after a bearish shooting star candle was recorded on 7/14. Perhaps all the fanfare with the dollar and the euro at parity was one of those headline tops. Only time will tell. The WEEKLY chart below shows a bullish stance as a long cup base was taken out at the 104 level dating back to COVID. Remember the longer the base the greater the space so it would not be surprising to see a successful retest in that area. The softer dollar has let energy spread its wings a bit and it has repercussions on the ten-year yield as well as one can see on the simple PRICE chart at the bottom of the dollar chart. It is breaking BELOW a bear flag and we know from FALSE moves come fast moves in the opposite direction (could make case for head and shoulders breakdown too). Overall market bears will say the current rally will lose its footing on the retest, and the bulls could declare the WEEKLY chart below is still to elevated above its 50 and 200-day SMAs. It's what makes a market, isn't it?
Consumer Show Time:
- We have been stating for weeks that we would like to see a broadening out in the retail space, not just TSLA and AMZN doing the heavy lifting. That did not happen last week with the explosion in the XLY from its top two holdings. To me, TSLA looks more appealing with a 9.1% gain last week after the prior week jumped 13.4%. A move above its 200-day SMA just above the very round 900 number puts a WEEKLY double bottom in focus into year-end (1152.97 pivot). AMZN and TSLA are both currently 28% off most recent 52-week highs but I think this one is the vulnerable of the two as it fills in an upside gap and recorded a doji candle Friday. Those candles are adept at signaling possible exhaustion and this could be possible after its recent 30% plus advance. Add to that the recent split and it could underperform going forward. If weakness arises consumer discretionary via the XLY could suffer. We are starting to see some more participation from sector with F and HOG in autos, DECK ONON and CROX in footwear, MAR in hotels, WING and CMG among casual diners, and JAKK in toys this week scoring solid WEEKLY gains. These are almost exclusively from depressed levels, but bulls would state the runway higher could be long. Stay tuned.
Good luck.
This article requires a Chartsmarter membership. Please click here to join.
Tech Rebound:
- Things tend to look best at the top and gloomiest at the bottom. While nothing is sure, the Nasdaq completed a very strong MONTHLY candle Friday, and notice on the chart below the last 2 times that happened in January 2019 the tech-heavy index rallied for 3 consecutive months and 10 of the next 12 months. And even more impressive following the April 2020 precedent it advanced 15 of the next 19 months. The similarities exist as the month of January 2019 jumped 11.9%, the month of April 2020 screamed higher by 19.2%, and July powered ahead by 12.6% (in the last decade there have been four total double-digit MONTHLY Nasdaq advances). Notice as well during each of these months volume was not robust, as at the start of rebounds belief is at a minimum. With the mega caps earnings now in the rearview mirror after last week, one may ask what the catalyst now is. There does not have to be one, but perhaps the market is looking months forward as it normally does to the mid-term elections in November.
Semi Surge:
- If technology is going to lead going forward, semiconductors will have to do much of the heavy lifting. Below this seasonality chart of the SMH July happens to be one of the best months as it has risen all 5 times since 2018. And look at the number on the bottom of the column that shows an average MONTHLY return of 7% during the time period. Of course, that is noteworthy, but if one glances right to November that has gained the last 4 years 100% of the time and by a whopping average of 9.6%. It is easy to see that Q4 is the firmest since 2018, and from a seasonality perspective, the semis should simply consolidate their gains in August and September with traditional mediocre returns. That would be a prudent pause, but remember if one is to produce alpha some will gain much more than peers. In that respect, let us take a look at a few that have been acting well already, as they are likely to continue to outperform.
Semi Lookers:
- Semiconductor play down 2% YTD and higher by 3% over last one year period. Dividend yield of 1.8%.
- Name 10% off most recent 52-week highs (AMD 43% off its annual peak) and has broken lower highs from late May-early June on this current 4-week winning streak that gained a combined 19%.
- Earnings mostly lower off 2.4, 1.6 and .3% on 5/18, 11/23 and 8/18/21 (rose 3.9% on 2/16).
- Enter after recent break above double bottom base.
- Entry ADI here. Stop 163 (REPORTS 8/17 before open).
- Semi equipment play down 11% YTD and up 20% over last one-year period. Dividend yield of 1.1%.
- Name 16% off most recent 52-week highs (NVDA 48% off its annual peak) and current 4-week winning streak up a combined 27%, and all four CLOSED at top of WEEKLY range. Now above late May-early June highs too.
- Earnings mostly higher up 3.7, 1.3, and 4.3% on 7/29, 1/28 and 10/28/21 (fell 4.1% on 4/29).
- Enter on pullback into double bottom breakout.
- Entry KLAC 375. Stop 349.
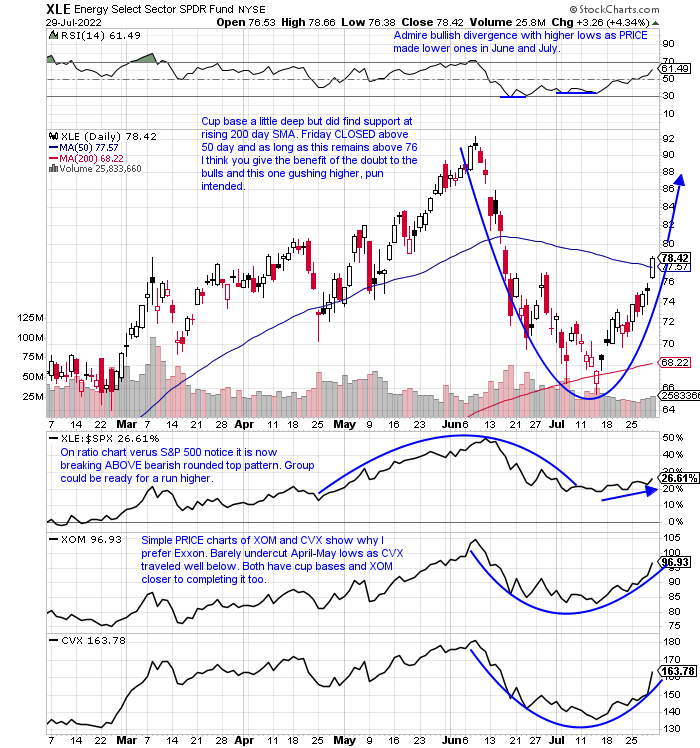
Is Energy Back?
- Perhaps the right answer is it just needed a healthy breather. Of course, on a YTD basis, it is going to take a herculean effort to overtake energy with the XLE up more than 44% in 2022 (every other major S&P sector is lower this year so far except the XLU). But this week the group was the best performing group as the XLE gained more than 10%, its third double-digit WEEKLY advance. This was aided by both XOM and CVX reporting before the bell Friday. I still prefer the chart of XOM as it is a bit smoother as it makes its way to the very round par number for a second time and approaches a cup base pivot of 105.67. Perhaps the best it can do is pause here and form a handle on this potential base. My favorite name continues to be OXY, which Warren has a sizable position in, and it never really came into close proximity to its 200-day SMA like most others, recording much smaller drawdowns. Do not sleep on the services names as they may play catch up with the OIH rising 14.6% last week. Thought this was an interesting article on the subject.
Dollar Implications:
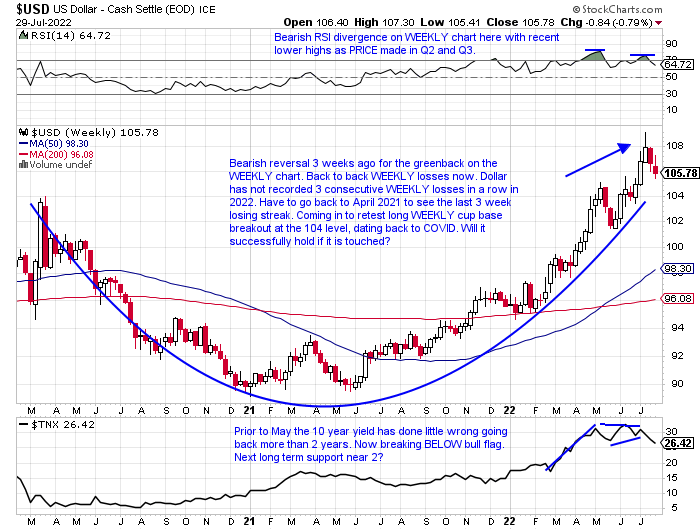
- Market participants have been watching the US Dollar closely to determine which way the averages will move. It is no coincidence that the market has rallied as the dollar fell 9 of the last 11 sessions after a bearish shooting star candle was recorded on 7/14. Perhaps all the fanfare with the dollar and the euro at parity was one of those headline tops. Only time will tell. The WEEKLY chart below shows a bullish stance as a long cup base was taken out at the 104 level dating back to COVID. Remember the longer the base the greater the space so it would not be surprising to see a successful retest in that area. The softer dollar has let energy spread its wings a bit and it has repercussions on the ten-year yield as well as one can see on the simple PRICE chart at the bottom of the dollar chart. It is breaking BELOW a bear flag and we know from FALSE moves come fast moves in the opposite direction (could make case for head and shoulders breakdown too). Overall market bears will say the current rally will lose its footing on the retest, and the bulls could declare the WEEKLY chart below is still to elevated above its 50 and 200-day SMAs. It's what makes a market, isn't it?
Consumer Show Time:
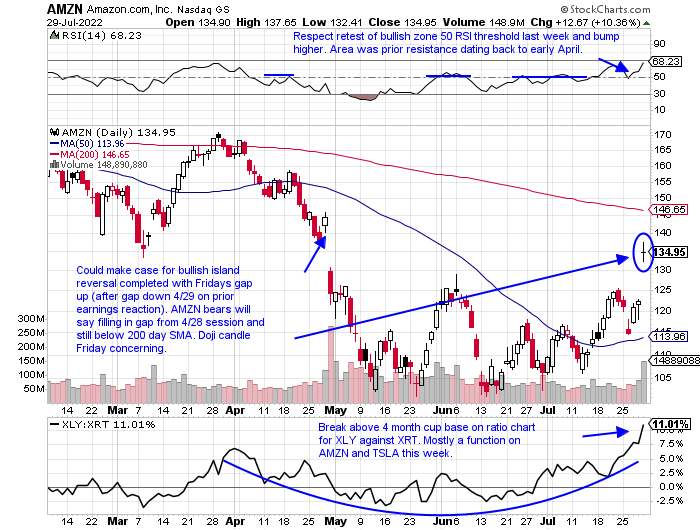
- We have been stating for weeks that we would like to see a broadening out in the retail space, not just TSLA and AMZN doing the heavy lifting. That did not happen last week with the explosion in the XLY from its top two holdings. To me, TSLA looks more appealing with a 9.1% gain last week after the prior week jumped 13.4%. A move above its 200-day SMA just above the very round 900 number puts a WEEKLY double bottom in focus into year-end (1152.97 pivot). AMZN and TSLA are both currently 28% off most recent 52-week highs but I think this one is the vulnerable of the two as it fills in an upside gap and recorded a doji candle Friday. Those candles are adept at signaling possible exhaustion and this could be possible after its recent 30% plus advance. Add to that the recent split and it could underperform going forward. If weakness arises consumer discretionary via the XLY could suffer. We are starting to see some more participation from sector with F and HOG in autos, DECK ONON and CROX in footwear, MAR in hotels, WING and CMG among casual diners, and JAKK in toys this week scoring solid WEEKLY gains. These are almost exclusively from depressed levels, but bulls would state the runway higher could be long. Stay tuned.
Good luck.