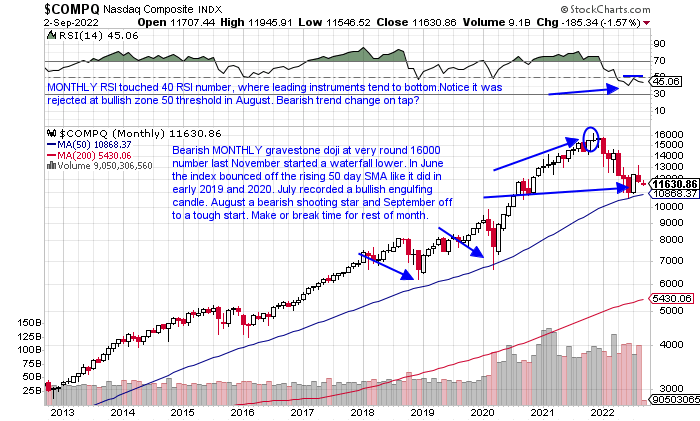
Monthly Nasdaq Candle:
- Coming into the month of August I looked at a MONTHLY candle on the Nasdaq and was inspired by what I saw. The chart below shows the last 2 times it touched its rising 50-day SMA in early 2019 and 2020 and the following month recorded a bullish candle it was up and off to the races. Instead August concluded with a bearish shooting star that was rejected near the very round 13000 number. It has still not broken the 50-day and it is normal to cut back into a bullish candle so there is some time but the propulsion that the previous 2 times is not there now. There could be a bearish RSI trend change with the rejection at 50 and now a move back lower (notice since 2014 it was repeatedly above 80 number), a level of former support. Last week the semis slumped almost 7% and software slipped as the IGV fell nearly 5%. Names like OKTA MDB and GTLB all cratered between 25-30% for the week and often the best loss is the first loss and move on. The only thing that may be positive at the moment is the absence of bulls. But PRICE action is omnipotent and that is painting a clear and bearish picture.
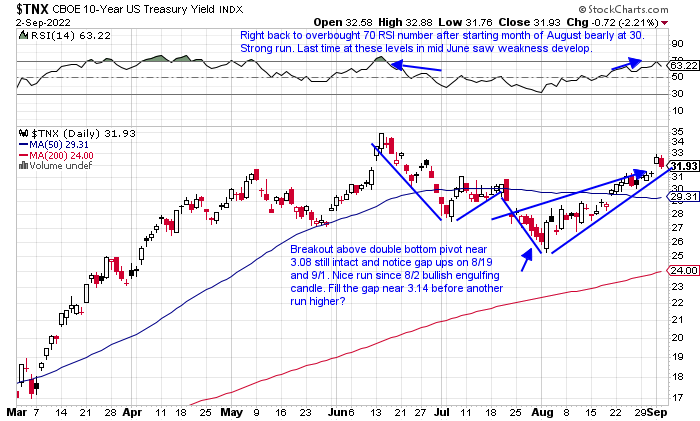
Ten-Year Angst:
- Listening to market prognosticators, often a futile endeavor can be hazardous to your wealth. On TV outlets one can rarely go 30 minutes without hearing someone's opinion on the direction of the ten year. For sure it has implications for consumers on so many levels but if one was smart they would just focus on PRICE action. The $TNX is now on a 5 week winning streak up better than 5% last week to record its second straight WEEKLY CLOSE above the "round" 3 number. It did that as well for rising for 3 consecutive weeks between the weeks ending 6/10-24 before dropping to 2.52. Its intraweek high last week was the CLOSING low for the bearish shooting star WEEKLY candle ending 6/17. Most likely next week we fill the gap near 3.14 from the 8/31 session which would also be the area of the double bottom breakout before resuming its uptrend. Peering at the TLT it slumped 3% this week after a gap down of 2.1% on 9/1, looking very similar to the gap down of 3% on 6/13 that may just be a double bottom in this rough range between 110-120 for nearly 2 months.
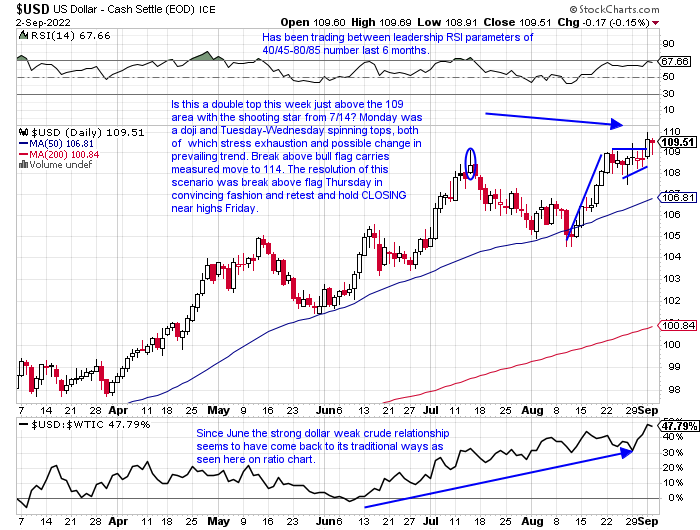
Greenback Breaks Out:
- From long base breakouts often long uptrends are born. Below is the daily chart of the dollar to focus on the near term, but it is also higher in 11 of the last 15 months dating back to a MONTHLY bullish engulfing candle at the very round 90 number in June 2021. That 90 level was also a double bottom with the first 4 months of 2018 and was resistance in 2004-2006, and rough resistance between 2008-2010. MONTHLY RSI is near the white-hot 80 area where it last traded in early 2015. On its daily chart here notice the 109 area which produced three dubious candles to start the week, but Thursday broke above a bull flag and Friday retested that breakout and CLOSED near highs for the session. It negated the shooting star from 7/14 in the process. The path to least resistance is now higher for the greenback, and that should weigh on markets heading into the start of the traditional bullish Q4 of a mid-term election year on 10/1. Stay nimble until then.
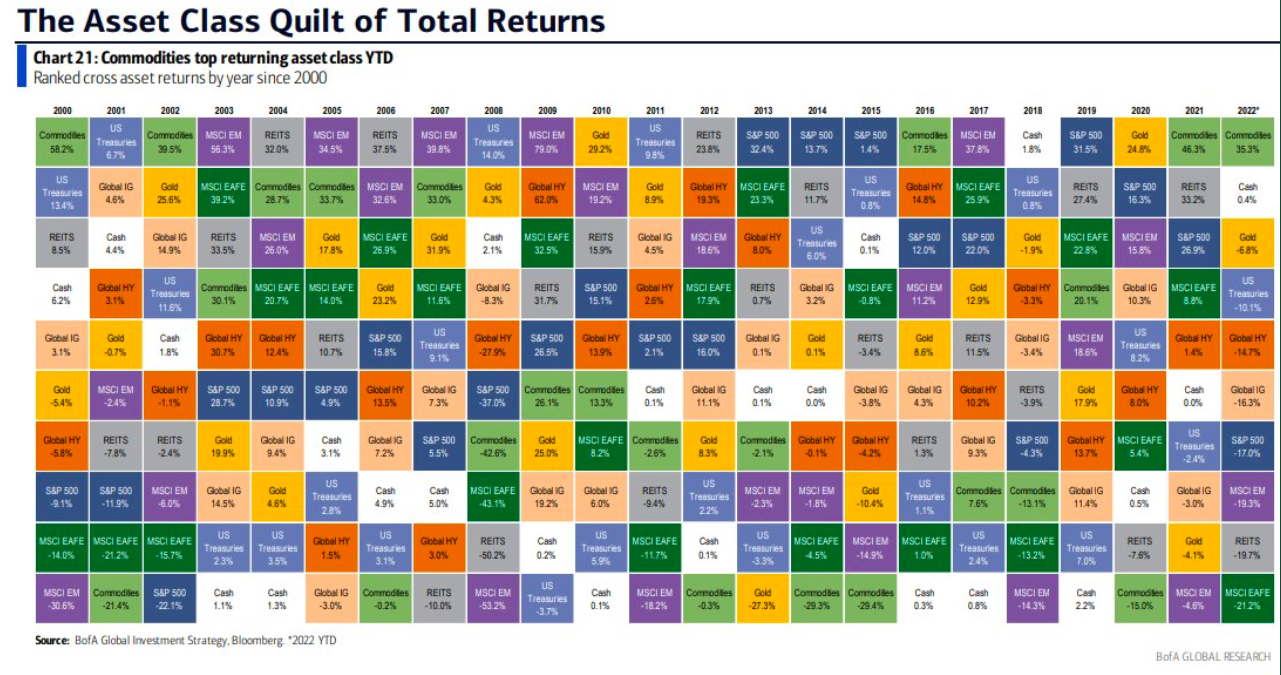
Strength Begets Strength:
- From the chart below courtesy of Bank Of America, one can see so far in 2022 commodities are backing up their big showing in 2021. In fact, looking back to 2000 it seems to be either feast or famine with commodities, no pun intended. In 2020 they were the worst asset class along with 2001, 2006, 2012, and 2014-15. Of course, a big part of that is energy and inflation in general but it is a good reminder to stick with what's working. Surely regarding energy, one would have had to endure big drawdowns but the trend is firmly higher. It is not the case among all commodities however but natural gas has been strong although the very round 10 number put a stop to its rally. But gold, silver and copper, and lumber are all in downtrends and it will be interesting to see where they are going into year-end. Coal and uranium are acting well and below are a few charts we will be watching going forward.
Commodity Lookers:
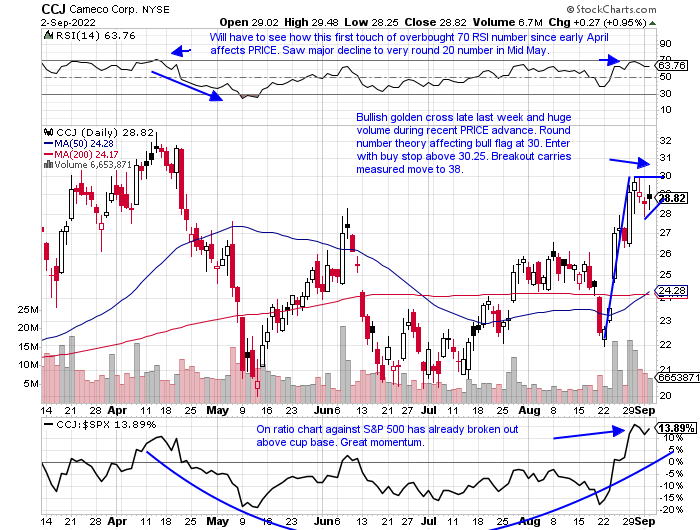
- Canadian nuclear play up 32% YTD and 39% over last one year period. Dividend yield of .4%.
- Name 11% off most recent 52-week highs and advanced 7 of last 9 weeks. Strong accumulation this week up 8.1% on double average WEEKLY volume, after the prior week jumped more than 18% on strong trade too.
- Earnings mixed with larger gains of 14.8 and 8.7% on 2/9 and 7/27 and losses of 7.2 and 4.6% on 5/5 and 10/29/21.
- Enter with break above bull flag pattern.
- Entry CCJ 30.25. Stop 27.75.
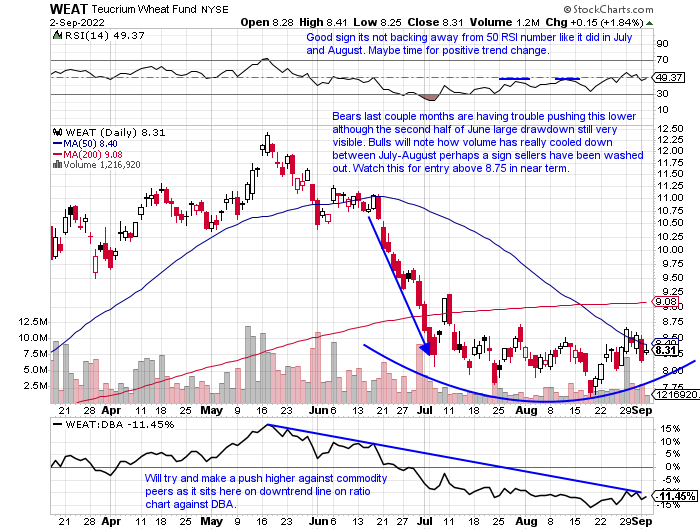
- Fund up 12% YTD and 19% over last one year period.
- Name now 35% off most recent 52 week highs and trading back into the huge range of the combined 40% advance the 2 weeks ending between 2/25-3/4. Last 6 weeks has followed pattern of one up and one down. Bollinger Bands tightening.
- Enter with decisive break above 2 month sideways channel.
- Entry WEAT 8.75. Stop 7.75.
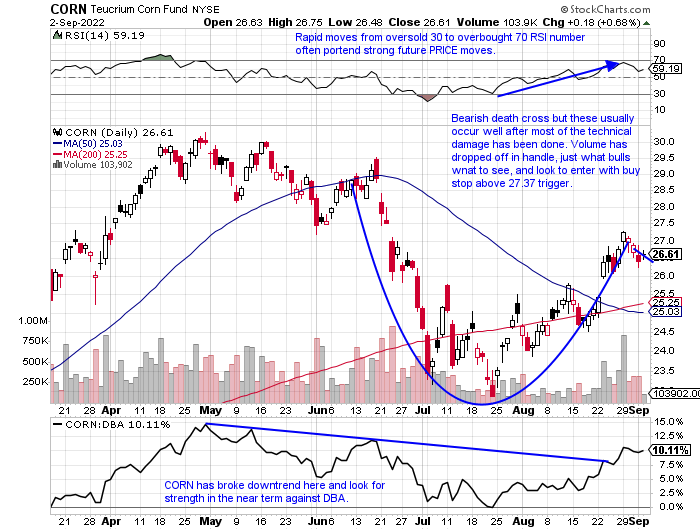
- Fund up 24% YTD and 35% over last one year period.
- Name 12% off most recent 52 week highs and corn has largest weighting in DBA. Stopped at round 30 number in April-May and up 3 of last 6 weeks with the advancers strong. Weeks ending 7/29, 8/12 and 8/26 rose 9.2, 4.3 and 6.7% respectively.
- Enter with buy stop above cup with handle pivot.
- Entry CORN 27.37. Stop 26.25.
Good luck.
This article requires a Chartsmarter membership. Please click here to join.
Monthly Nasdaq Candle:
- Coming into the month of August I looked at a MONTHLY candle on the Nasdaq and was inspired by what I saw. The chart below shows the last 2 times it touched its rising 50-day SMA in early 2019 and 2020 and the following month recorded a bullish candle it was up and off to the races. Instead August concluded with a bearish shooting star that was rejected near the very round 13000 number. It has still not broken the 50-day and it is normal to cut back into a bullish candle so there is some time but the propulsion that the previous 2 times is not there now. There could be a bearish RSI trend change with the rejection at 50 and now a move back lower (notice since 2014 it was repeatedly above 80 number), a level of former support. Last week the semis slumped almost 7% and software slipped as the IGV fell nearly 5%. Names like OKTA MDB and GTLB all cratered between 25-30% for the week and often the best loss is the first loss and move on. The only thing that may be positive at the moment is the absence of bulls. But PRICE action is omnipotent and that is painting a clear and bearish picture.
Ten-Year Angst:
- Listening to market prognosticators, often a futile endeavor can be hazardous to your wealth. On TV outlets one can rarely go 30 minutes without hearing someone's opinion on the direction of the ten year. For sure it has implications for consumers on so many levels but if one was smart they would just focus on PRICE action. The $TNX is now on a 5 week winning streak up better than 5% last week to record its second straight WEEKLY CLOSE above the "round" 3 number. It did that as well for rising for 3 consecutive weeks between the weeks ending 6/10-24 before dropping to 2.52. Its intraweek high last week was the CLOSING low for the bearish shooting star WEEKLY candle ending 6/17. Most likely next week we fill the gap near 3.14 from the 8/31 session which would also be the area of the double bottom breakout before resuming its uptrend. Peering at the TLT it slumped 3% this week after a gap down of 2.1% on 9/1, looking very similar to the gap down of 3% on 6/13 that may just be a double bottom in this rough range between 110-120 for nearly 2 months.
Greenback Breaks Out:
- From long base breakouts often long uptrends are born. Below is the daily chart of the dollar to focus on the near term, but it is also higher in 11 of the last 15 months dating back to a MONTHLY bullish engulfing candle at the very round 90 number in June 2021. That 90 level was also a double bottom with the first 4 months of 2018 and was resistance in 2004-2006, and rough resistance between 2008-2010. MONTHLY RSI is near the white-hot 80 area where it last traded in early 2015. On its daily chart here notice the 109 area which produced three dubious candles to start the week, but Thursday broke above a bull flag and Friday retested that breakout and CLOSED near highs for the session. It negated the shooting star from 7/14 in the process. The path to least resistance is now higher for the greenback, and that should weigh on markets heading into the start of the traditional bullish Q4 of a mid-term election year on 10/1. Stay nimble until then.
Strength Begets Strength:
- From the chart below courtesy of Bank Of America, one can see so far in 2022 commodities are backing up their big showing in 2021. In fact, looking back to 2000 it seems to be either feast or famine with commodities, no pun intended. In 2020 they were the worst asset class along with 2001, 2006, 2012, and 2014-15. Of course, a big part of that is energy and inflation in general but it is a good reminder to stick with what's working. Surely regarding energy, one would have had to endure big drawdowns but the trend is firmly higher. It is not the case among all commodities however but natural gas has been strong although the very round 10 number put a stop to its rally. But gold, silver and copper, and lumber are all in downtrends and it will be interesting to see where they are going into year-end. Coal and uranium are acting well and below are a few charts we will be watching going forward.
Commodity Lookers:
- Canadian nuclear play up 32% YTD and 39% over last one year period. Dividend yield of .4%.
- Name 11% off most recent 52-week highs and advanced 7 of last 9 weeks. Strong accumulation this week up 8.1% on double average WEEKLY volume, after the prior week jumped more than 18% on strong trade too.
- Earnings mixed with larger gains of 14.8 and 8.7% on 2/9 and 7/27 and losses of 7.2 and 4.6% on 5/5 and 10/29/21.
- Enter with break above bull flag pattern.
- Entry CCJ 30.25. Stop 27.75.
- Fund up 12% YTD and 19% over last one year period.
- Name now 35% off most recent 52 week highs and trading back into the huge range of the combined 40% advance the 2 weeks ending between 2/25-3/4. Last 6 weeks has followed pattern of one up and one down. Bollinger Bands tightening.
- Enter with decisive break above 2 month sideways channel.
- Entry WEAT 8.75. Stop 7.75.
- Fund up 24% YTD and 35% over last one year period.
- Name 12% off most recent 52 week highs and corn has largest weighting in DBA. Stopped at round 30 number in April-May and up 3 of last 6 weeks with the advancers strong. Weeks ending 7/29, 8/12 and 8/26 rose 9.2, 4.3 and 6.7% respectively.
- Enter with buy stop above cup with handle pivot.
- Entry CORN 27.37. Stop 26.25.
Good luck.