Bears Gaining Steam:
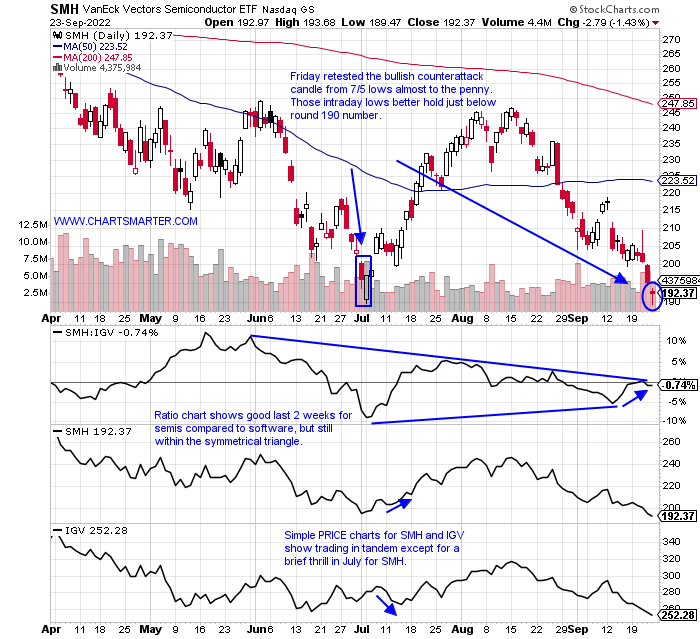
- Bear markets are ruthless. There is not a lot that bulls can hang their hat on these days. Interest rates and the dollar continue to skyrocket. We know that last week was one of the toughest weeks of the year, and overall PRICE action has been lousy. Three of 5 days last week witnessed all 11 of the major S&P sector falling, and on a WEEKLY basis, every sector fell with defensive staples, utilities, and healthcare acting "best" but still falling between 2-3%. Looking for a silver lining that has been a dangerous endeavor, the semis, like the Nasdaq recorded a mild reversal Friday with bullish hammers, for the SMH at a key level. Interesting were they did not take out the summer lows (SMH did by less than .50 Friday but CLOSED well above) as software did. This is a very minor green shoot but one we could look back on if this market can find its footing going into a strong seasonal mid-term election period starting with Q4. Sentiment is lousy too. But respect the power of the bear and if those lows on the semis are taken out on a CLOSING basis look out below.
Bigger They Are The Harder They Fall:
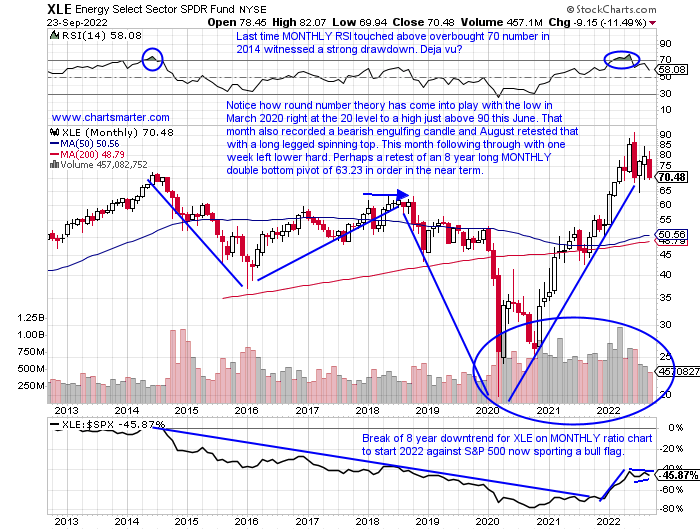
- It is no secret just how well energy has held up in 2022 and it is likely to hold on to be the best performing major S&P sector for two years in a row. Remember 2021 the XLE rose more than 50% and this year thus far is up 31% with its next closest competitor the XLU gaining 2% (and prior to that was the WORST actor for 3 consecutive years). But eventually, the bear market chops down every group and that looks like what is happening currently. Last week the XLE dropped more than 9% making it the worst behaved of the 11 major S&P sector groups. If one wants to take a long-term MONTHLY look at the XLE the chart below looks like it has another 10% to the downside to me before it retests a long double-bottom breakout that occurred this January with a gain of 18.8%. And notice the accumulation as positive volume trends since the start of 2021 and that April 2021 as well with a bullish piercing line candle that was retested with a bullish morning star completed in November 2021. Nothing goes up in a straight line and crude not being able to catch a bid, with everyone stating "when China comes back on line", or the "European energy crisis", or "having to refill the SPR", another leg down is likely for the space.
Rate Shock:
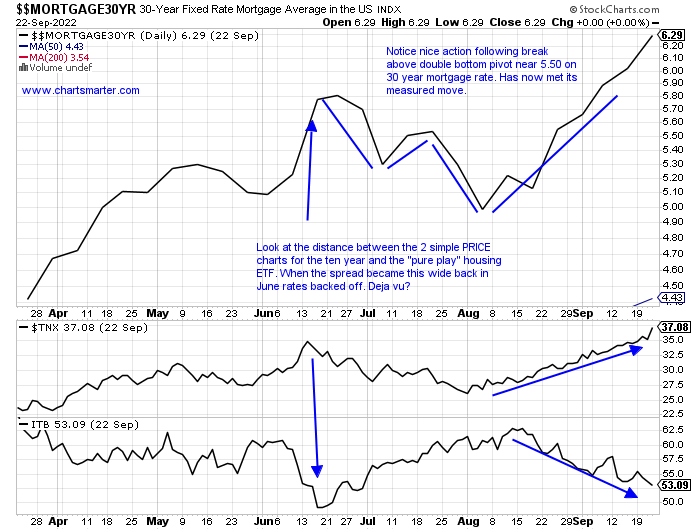
- Treasury yields are treacherous when they move in the manner in which they are currently doing. Rising yields affect so many moving parts including the US Dollar which surged to 20-year highs last week. That finally may have put a nail in the coffin for energy, but yields also impact things like car loans and of course housing. Below we take a look at the chart of the 30-year fixed rate mortgage (a MONTHLY chart would look parabolic as the 30-year was near a low of 2.65 to start 2021). Defying conventional logic, nothing goes up in a straight line, and peering at the two simple PRICE charts below of the 10-year treasury yield and the housing ETF via the ITB sees a large spread. The last time it was this wide in June rates "cooled off". Interestingly the ITB did record a bullish counterattack candle to avoid a stop at the 53 level we spoke about last week. Are they signaling something of a possible near-term peak in rates too?
Will The Real Crypto Leader Please Stand Up:
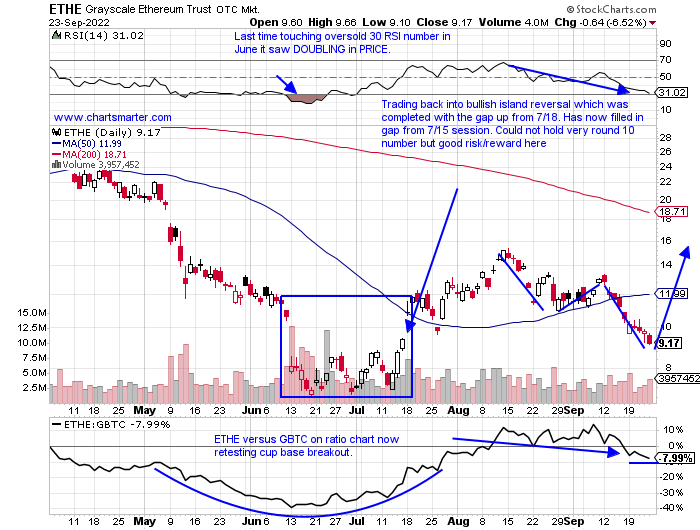
- That for sure is a facetious statement as both of the below instruments in the ETHE and GBTC are now at least 80% from their most recent 52 week highs. ETHE is now on a 10 session losing streak and last week dropped 12.6% after slumping the week before by 19.3%. That is a far cry from when it hit all time highs during a 15 of 17 week winning streak the weeks ending between 7/23-11/12/21. GBTC has a bit more history on a chart perspective and it did register an impressive from from the very round 10 number to almost 60 from the weeks ending 10/2/20-2/19/21. Since the first week in April the fund has advanced on a WEEKLY basis just 8 times and last week broke firmly below the 12-16 range that was in place since the 20% gap down on 6/13. To me, a man in my 50s and not looking for tremendous volatility like the underlying coins themselves impose I think ETHE is the better play of the two.
Nuclear Ambitions:
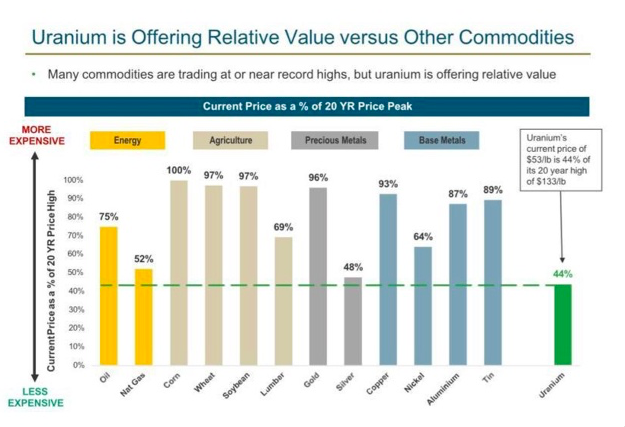
- "Fossil fuels now supply about 83% of the world’s commercial energy, compared to 86% in the year 2000. The new renewables (wind and solar) now provide (after some two decades of development) still less than 6% of the world’s primary energy, still less than hydroelectricity. What are the chances that after going from 86% to 83% during the first two decades of the 21st century the world will go from 83% to zero during the next two decades?" (thanks to Will Nutting and the chart below from Nick Lawson that indicates uranium value). This is where I still believe nuclear will play a role in the transition to greener energy over the coming decades, which I am all for. Not all are convinced of this as Belgium this week shut down a reactor for good even in the face of a winter crisis (the decision was made over a decade ago, however). But this article from earlier this year demonstrates that many nations "are considering, planning or starting nuclear power programs." Let's take a look at 2 names that look attractive.
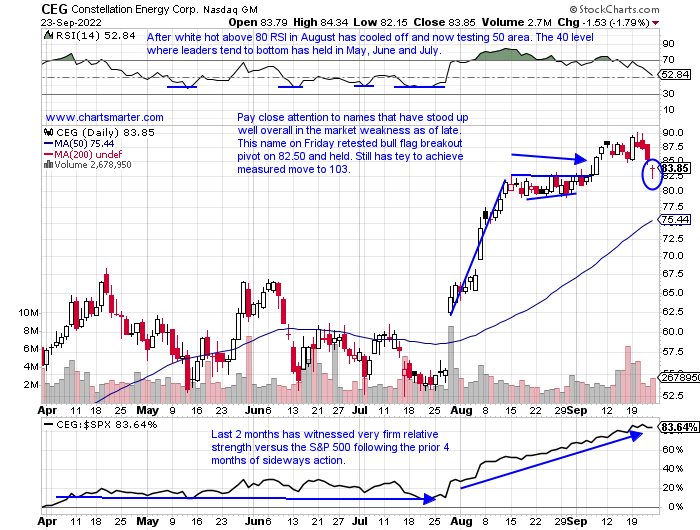
- Nuclear/utility play up 45% over last 3 month period. Dividend yield of .7%.
- Name 7% off most recent 52-week highs, rejection at very round 90 number last week. Amazed by very taut action 3 weeks ending between 8/19-9/2 that all CLOSED within just .24 of each other after prior 3 weeks surged by a combined 44%.
- Just 2 earnings reactions up 10.1% on 8/5 and lower by 6.8% on 5/12.
- Enter on pullback into bull flag breakout retest.
- Entry CEG 82.75. Stop 75.
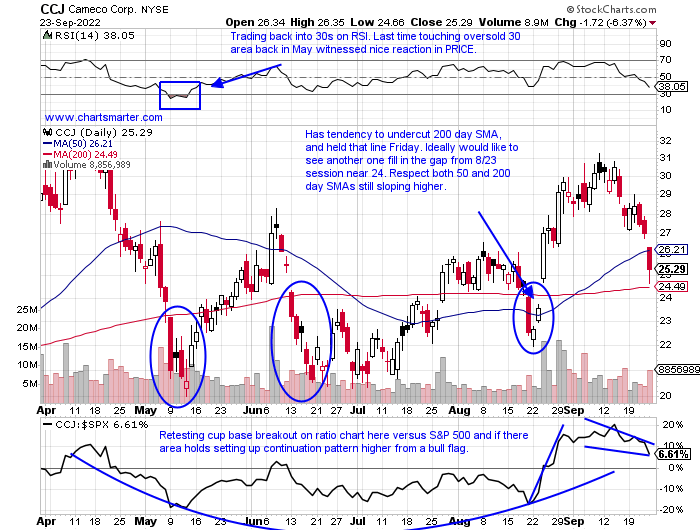
- Canadian uranium play up 16% YTD and 19% over last one year period. Dividend yield of .4%.
- Name 22% off most recent 52-week highs and last 2 weeks have given up 16% roughly half of the 3-week winning streak that surged 31% between weeks ending 8/26-9/9. On the WEEKLY chart still making higher lows since March '20.
- Earnings mixed with larger gains of 14.8 and 8.7% on 2/9 and 7/27 and losses of 7.2 and 4.6% on 5/5 and 10/29/21.
- Enter on gap fill.
- Entry CCJ 24. Stop 21.75.
Good luck.
This article requires a Chartsmarter membership. Please click here to join.
Bears Gaining Steam:
- Bear markets are ruthless. There is not a lot that bulls can hang their hat on these days. Interest rates and the dollar continue to skyrocket. We know that last week was one of the toughest weeks of the year, and overall PRICE action has been lousy. Three of 5 days last week witnessed all 11 of the major S&P sector falling, and on a WEEKLY basis, every sector fell with defensive staples, utilities, and healthcare acting "best" but still falling between 2-3%. Looking for a silver lining that has been a dangerous endeavor, the semis, like the Nasdaq recorded a mild reversal Friday with bullish hammers, for the SMH at a key level. Interesting were they did not take out the summer lows (SMH did by less than .50 Friday but CLOSED well above) as software did. This is a very minor green shoot but one we could look back on if this market can find its footing going into a strong seasonal mid-term election period starting with Q4. Sentiment is lousy too. But respect the power of the bear and if those lows on the semis are taken out on a CLOSING basis look out below.
Bigger They Are The Harder They Fall:
- It is no secret just how well energy has held up in 2022 and it is likely to hold on to be the best performing major S&P sector for two years in a row. Remember 2021 the XLE rose more than 50% and this year thus far is up 31% with its next closest competitor the XLU gaining 2% (and prior to that was the WORST actor for 3 consecutive years). But eventually, the bear market chops down every group and that looks like what is happening currently. Last week the XLE dropped more than 9% making it the worst behaved of the 11 major S&P sector groups. If one wants to take a long-term MONTHLY look at the XLE the chart below looks like it has another 10% to the downside to me before it retests a long double-bottom breakout that occurred this January with a gain of 18.8%. And notice the accumulation as positive volume trends since the start of 2021 and that April 2021 as well with a bullish piercing line candle that was retested with a bullish morning star completed in November 2021. Nothing goes up in a straight line and crude not being able to catch a bid, with everyone stating "when China comes back on line", or the "European energy crisis", or "having to refill the SPR", another leg down is likely for the space.
Rate Shock:
- Treasury yields are treacherous when they move in the manner in which they are currently doing. Rising yields affect so many moving parts including the US Dollar which surged to 20-year highs last week. That finally may have put a nail in the coffin for energy, but yields also impact things like car loans and of course housing. Below we take a look at the chart of the 30-year fixed rate mortgage (a MONTHLY chart would look parabolic as the 30-year was near a low of 2.65 to start 2021). Defying conventional logic, nothing goes up in a straight line, and peering at the two simple PRICE charts below of the 10-year treasury yield and the housing ETF via the ITB sees a large spread. The last time it was this wide in June rates "cooled off". Interestingly the ITB did record a bullish counterattack candle to avoid a stop at the 53 level we spoke about last week. Are they signaling something of a possible near-term peak in rates too?
Will The Real Crypto Leader Please Stand Up:
- That for sure is a facetious statement as both of the below instruments in the ETHE and GBTC are now at least 80% from their most recent 52 week highs. ETHE is now on a 10 session losing streak and last week dropped 12.6% after slumping the week before by 19.3%. That is a far cry from when it hit all time highs during a 15 of 17 week winning streak the weeks ending between 7/23-11/12/21. GBTC has a bit more history on a chart perspective and it did register an impressive from from the very round 10 number to almost 60 from the weeks ending 10/2/20-2/19/21. Since the first week in April the fund has advanced on a WEEKLY basis just 8 times and last week broke firmly below the 12-16 range that was in place since the 20% gap down on 6/13. To me, a man in my 50s and not looking for tremendous volatility like the underlying coins themselves impose I think ETHE is the better play of the two.
Nuclear Ambitions:
- "Fossil fuels now supply about 83% of the world’s commercial energy, compared to 86% in the year 2000. The new renewables (wind and solar) now provide (after some two decades of development) still less than 6% of the world’s primary energy, still less than hydroelectricity. What are the chances that after going from 86% to 83% during the first two decades of the 21st century the world will go from 83% to zero during the next two decades?" (thanks to Will Nutting and the chart below from Nick Lawson that indicates uranium value). This is where I still believe nuclear will play a role in the transition to greener energy over the coming decades, which I am all for. Not all are convinced of this as Belgium this week shut down a reactor for good even in the face of a winter crisis (the decision was made over a decade ago, however). But this article from earlier this year demonstrates that many nations "are considering, planning or starting nuclear power programs." Let's take a look at 2 names that look attractive.
- Nuclear/utility play up 45% over last 3 month period. Dividend yield of .7%.
- Name 7% off most recent 52-week highs, rejection at very round 90 number last week. Amazed by very taut action 3 weeks ending between 8/19-9/2 that all CLOSED within just .24 of each other after prior 3 weeks surged by a combined 44%.
- Just 2 earnings reactions up 10.1% on 8/5 and lower by 6.8% on 5/12.
- Enter on pullback into bull flag breakout retest.
- Entry CEG 82.75. Stop 75.
- Canadian uranium play up 16% YTD and 19% over last one year period. Dividend yield of .4%.
- Name 22% off most recent 52-week highs and last 2 weeks have given up 16% roughly half of the 3-week winning streak that surged 31% between weeks ending 8/26-9/9. On the WEEKLY chart still making higher lows since March '20.
- Earnings mixed with larger gains of 14.8 and 8.7% on 2/9 and 7/27 and losses of 7.2 and 4.6% on 5/5 and 10/29/21.
- Enter on gap fill.
- Entry CCJ 24. Stop 21.75.
Good luck.