"Disasters have a way of not happening." Byron Wein
Size Matters:
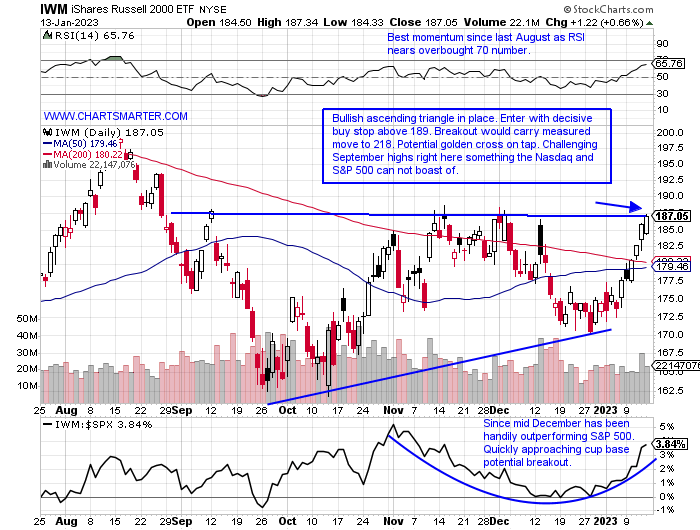
- In life, many like to root for the underdog. Often that role is filled by someone short in stature. The small-cap space is showing why many are becoming a bit excited about this nascent run in markets. This area is often seen as a leading indicator and a barometer for "risk on". With 2023 now two weeks in the Russell 2000 is showing the way. For a second consecutive week, it has outperformed the "big" three major indexes. Last week the IWM added a very healthy 5.3% while the Nasdaq, S&P 500, and Dow rose by 4.8, 2.7, and 2% respectively. The week prior it advanced by 1.8%, with the others gaining between 1-1.5%. A theme could be developing here and a big move was likely imminent with the extraordinarily taut WEEKLY CLOSES the 3 weeks ending between 12/16-30/22 which all finished within just 3 pennies of each other, not a typo. A move through 190 would negate the series of lower highs for the IWM dating back to the week ending 11/12/21. Risk appetite is growing.
Smarter Market?
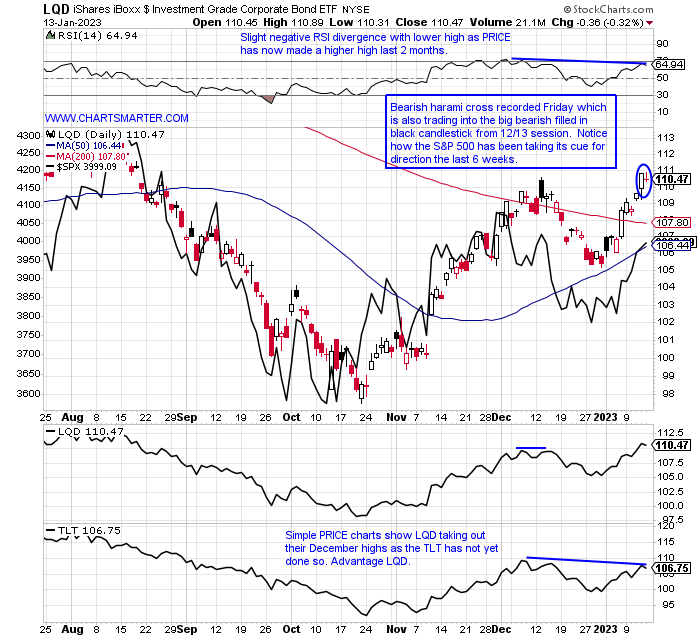
- It has always been mentioned that the bond market is smarter than the stock market, and we know for certain its sheer size commands respect. The chart below of the LQD suggests that it should be watched with an eagle eye as it has been leading in PRICE compared to the S&P 500. Is the strength in the LQD saying that corporation balance sheets are to be improving over the next 6 months as markets tend to look ahead? One thing for sure is that the LQD is now above both its 50 and 200-day SMAs, something the TLT can not say, and it trades 15% off most recent 52-week highs while the TLT is now 26% from its annual peak. My belief is this is a vote of confidence and corporate bond issuance is off to a good start in 2023 so far. The doji candle Friday after a nice run speaks to some possible back and filling which should see equity markets respond in harmony as financial instruments catch their breath after a nice recent run. Last week we spoke of how junk bonds were prominent and now investment grade is playing copycat.
Deflation?
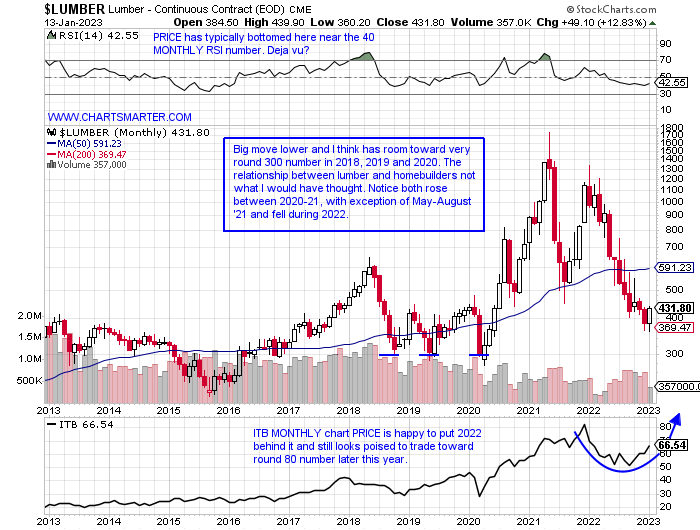
- Commodities have seen some precipitous moves both higher and lower. Of course, gold has been on a torrid move upward with the GLD up 8 of the last 11 weeks with five of those gainers up by at least 2%. Its MONTHLY chart looks ready to test the 190s at some point in Q1 in a double bottom pattern in a base that began in mid-2020. Copper is surging, but then we have some commodities that seem to be in free fall, notably natural gas as Europe at the moment is experiencing a warm winter. WEAT is lower by 41% off last February's highs and has declined 11 of the last 15 weeks. JO is also down 11 of the 15 weeks and the last 3 alone have slipped more than 12%. But the chart below of lumber may be the poster boy for deflation, which Elon Musk stated this week that he believes we are in. In 2022 it rose just 3 months and had a wild range between rough 1300-400 numbers. In May 2021 it touched above 1700, in what was a supply chain shock and had little to do with inflation. Will lumber softness have a positive impact on homebuilders?
Chipper Biotech Move:
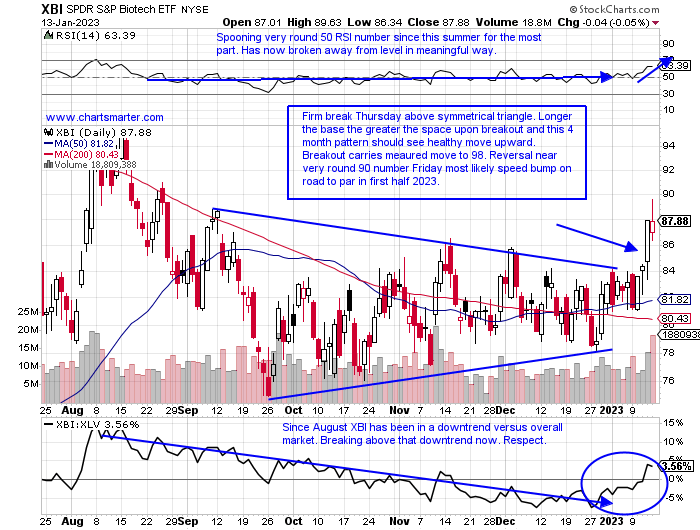
- Within the diverse healthcare space, the XLV covers all bases with biotech, pharma, medical equipment, and its largest holding is a healthcare provider in UNH. The ETF is now lower 5 of the last 6 weeks, although the damage is minimal so far being "just" 6% from most recent 52-week highs (the last 5 weeks have all CLOSED very taut within just .65 of each other). Digging deeper into the group the widely followed biotech names are making a move. The chart below of the XBI suggests another "risk on" flavor for the markets as it has been handily beating the IBB which is top heavy and comprised of the mega caps with GILD AMGN VRTX and REGN (those largest 4 holdings making up 30% of the IBB). The XBI is more "equal weighted" and made up of somewhat smaller more nimble names and the fund recorded a nice breakout this past week rising 5.7% more than double that of the IBB. And that occurred with big moves lower in names like HALO NBIX last week and AXSM the week before. Over the last one month period the XBI has gained 6%, the IBB is UNCH and the XLV is down 3%. There is a new sheriff in town.
Industrial Fortitude:
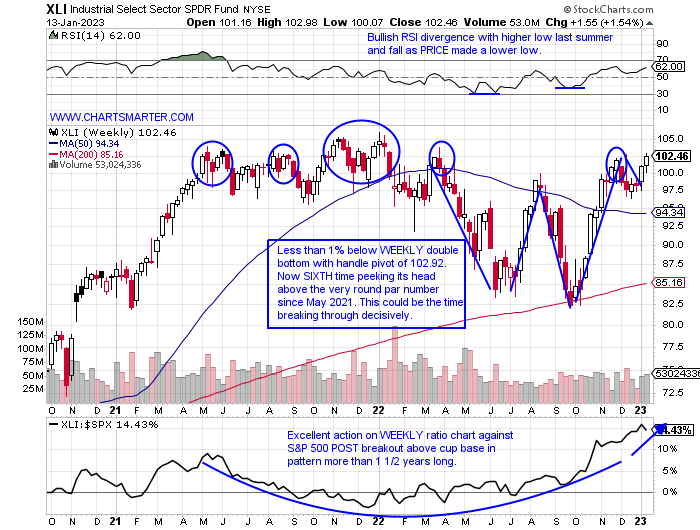
- It is very easy to get caught up with the seductive tech bounce, but let us focus on what has been working on a bit longer of a time frame. Over the last 3-month time period, the XLI has advanced 19% making it the second-best major S&P sector actor out of 11 (trailing just materials by less than 1%). Transportation services have been the largest contributor to the strength, funny as everyone is anticipating a recession. FDX did record a bearish shooting star WEEKLY candle this week after a 50-handle run from the WEEKLY doji candle ending 9/30/22 and finding resistance on its daily near its 200-day SMA (I think this fills in the upside gap from the 9/15 session right at the very round 200 number). Aerospace has done its part with BA higher a very impressive 13 of the last 15 weeks. Curiously lagging are the usually reliable waste management plays, as WM and RSG are lower over the last 3 months, with the latter on a 6-week losing streak. Let us take a look at two names with attractive charts below.
Fluor:
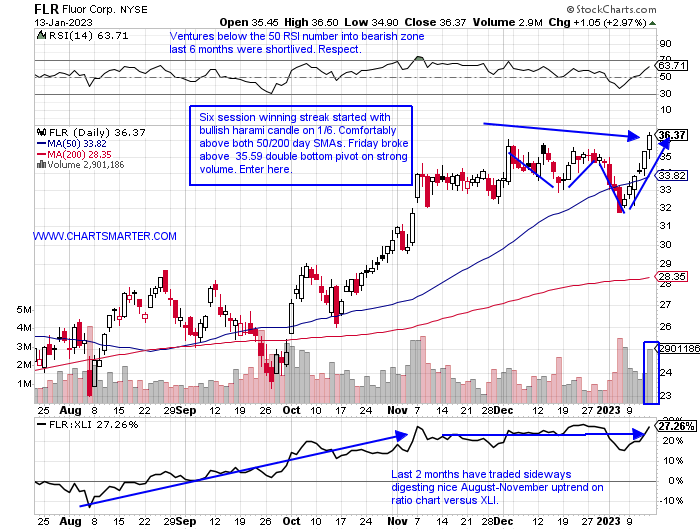
- Industrial play up 5% YTD and higher by 56% over last one year period.
- Name at multi-year highs and on WEEKLY chart has been making higher lows since September 2021. Up 31% over the last 3-month period while peers ACM PWR and J are higher by 23, 14, and 13% respectively.
- Earnings mixed up 6.1 and 3.2% on 11/4 and 5/6 and lower by 9.1 and 5.4% on 8/5 and 2/22.
- Enter after break above double bottom base.
- Entry FLR here. Stop 34.
GXO Logistics:
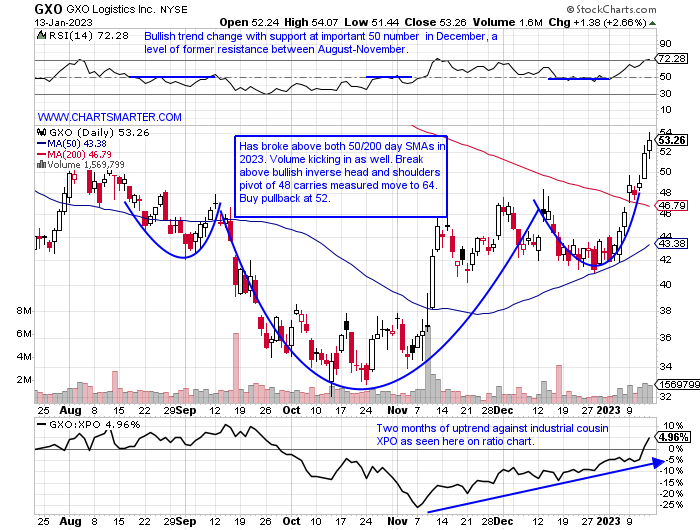
- Industrial play up 25% YTD and lower by 41% over last one year period.
- Name 42% off most recent 52 week highs and was well regarded coming public, doubling from 50-100 between July-November 2021. Up 15.2% last week, its fourth-best advance ever, CLOSING above newly formed WEEKLY 50-day SMA.
- FOUR straight earnings reactions up 1.3, 4.7, 1, and 2.1% on 11/9, 8/3, 5/5, and 2/16.
- Enter on pullback into bullish inverse head and shoulders breakout.
- Entry GXO 52. Stop 48.
Good luck.
This article requires a Chartsmarter membership. Please click here to join.
"Disasters have a way of not happening." Byron Wein
Size Matters:
- In life, many like to root for the underdog. Often that role is filled by someone short in stature. The small-cap space is showing why many are becoming a bit excited about this nascent run in markets. This area is often seen as a leading indicator and a barometer for "risk on". With 2023 now two weeks in the Russell 2000 is showing the way. For a second consecutive week, it has outperformed the "big" three major indexes. Last week the IWM added a very healthy 5.3% while the Nasdaq, S&P 500, and Dow rose by 4.8, 2.7, and 2% respectively. The week prior it advanced by 1.8%, with the others gaining between 1-1.5%. A theme could be developing here and a big move was likely imminent with the extraordinarily taut WEEKLY CLOSES the 3 weeks ending between 12/16-30/22 which all finished within just 3 pennies of each other, not a typo. A move through 190 would negate the series of lower highs for the IWM dating back to the week ending 11/12/21. Risk appetite is growing.
Smarter Market?
- It has always been mentioned that the bond market is smarter than the stock market, and we know for certain its sheer size commands respect. The chart below of the LQD suggests that it should be watched with an eagle eye as it has been leading in PRICE compared to the S&P 500. Is the strength in the LQD saying that corporation balance sheets are to be improving over the next 6 months as markets tend to look ahead? One thing for sure is that the LQD is now above both its 50 and 200-day SMAs, something the TLT can not say, and it trades 15% off most recent 52-week highs while the TLT is now 26% from its annual peak. My belief is this is a vote of confidence and corporate bond issuance is off to a good start in 2023 so far. The doji candle Friday after a nice run speaks to some possible back and filling which should see equity markets respond in harmony as financial instruments catch their breath after a nice recent run. Last week we spoke of how junk bonds were prominent and now investment grade is playing copycat.
Deflation?
- Commodities have seen some precipitous moves both higher and lower. Of course, gold has been on a torrid move upward with the GLD up 8 of the last 11 weeks with five of those gainers up by at least 2%. Its MONTHLY chart looks ready to test the 190s at some point in Q1 in a double bottom pattern in a base that began in mid-2020. Copper is surging, but then we have some commodities that seem to be in free fall, notably natural gas as Europe at the moment is experiencing a warm winter. WEAT is lower by 41% off last February's highs and has declined 11 of the last 15 weeks. JO is also down 11 of the 15 weeks and the last 3 alone have slipped more than 12%. But the chart below of lumber may be the poster boy for deflation, which Elon Musk stated this week that he believes we are in. In 2022 it rose just 3 months and had a wild range between rough 1300-400 numbers. In May 2021 it touched above 1700, in what was a supply chain shock and had little to do with inflation. Will lumber softness have a positive impact on homebuilders?
Chipper Biotech Move:
- Within the diverse healthcare space, the XLV covers all bases with biotech, pharma, medical equipment, and its largest holding is a healthcare provider in UNH. The ETF is now lower 5 of the last 6 weeks, although the damage is minimal so far being "just" 6% from most recent 52-week highs (the last 5 weeks have all CLOSED very taut within just .65 of each other). Digging deeper into the group the widely followed biotech names are making a move. The chart below of the XBI suggests another "risk on" flavor for the markets as it has been handily beating the IBB which is top heavy and comprised of the mega caps with GILD AMGN VRTX and REGN (those largest 4 holdings making up 30% of the IBB). The XBI is more "equal weighted" and made up of somewhat smaller more nimble names and the fund recorded a nice breakout this past week rising 5.7% more than double that of the IBB. And that occurred with big moves lower in names like HALO NBIX last week and AXSM the week before. Over the last one month period the XBI has gained 6%, the IBB is UNCH and the XLV is down 3%. There is a new sheriff in town.
Industrial Fortitude:
- It is very easy to get caught up with the seductive tech bounce, but let us focus on what has been working on a bit longer of a time frame. Over the last 3-month time period, the XLI has advanced 19% making it the second-best major S&P sector actor out of 11 (trailing just materials by less than 1%). Transportation services have been the largest contributor to the strength, funny as everyone is anticipating a recession. FDX did record a bearish shooting star WEEKLY candle this week after a 50-handle run from the WEEKLY doji candle ending 9/30/22 and finding resistance on its daily near its 200-day SMA (I think this fills in the upside gap from the 9/15 session right at the very round 200 number). Aerospace has done its part with BA higher a very impressive 13 of the last 15 weeks. Curiously lagging are the usually reliable waste management plays, as WM and RSG are lower over the last 3 months, with the latter on a 6-week losing streak. Let us take a look at two names with attractive charts below.
Fluor:
- Industrial play up 5% YTD and higher by 56% over last one year period.
- Name at multi-year highs and on WEEKLY chart has been making higher lows since September 2021. Up 31% over the last 3-month period while peers ACM PWR and J are higher by 23, 14, and 13% respectively.
- Earnings mixed up 6.1 and 3.2% on 11/4 and 5/6 and lower by 9.1 and 5.4% on 8/5 and 2/22.
- Enter after break above double bottom base.
- Entry FLR here. Stop 34.
GXO Logistics:
- Industrial play up 25% YTD and lower by 41% over last one year period.
- Name 42% off most recent 52 week highs and was well regarded coming public, doubling from 50-100 between July-November 2021. Up 15.2% last week, its fourth-best advance ever, CLOSING above newly formed WEEKLY 50-day SMA.
- FOUR straight earnings reactions up 1.3, 4.7, 1, and 2.1% on 11/9, 8/3, 5/5, and 2/16.
- Enter on pullback into bullish inverse head and shoulders breakout.
- Entry GXO 52. Stop 48.
Good luck.