Process/Philosophy:
Why Technical Analysis Matters:
"Although there are good and bad companies, there is no such thing as a good stock; there are only good stock prices, which come and go." Ben Graham
- First and foremost the market is the best fundamental analyst on the planet. Over the long term fundamentals are all that matter. Trends are fundamental. Charts are fundamental. Great stocks trend higher because they have strong fundamentals. Conversely, weak stocks trend lower because of their weak fundamentals.
- The value in technical analysis is that it is quicker to pick up on changes in the underlying fundamental factors. Again over a one-year period, the fundamentals are imperative, but stocks will turn technically at tops and bottoms well before, as they anticipate changes in the fundamentals. The fundamentals take time to catch up to the technicals. Just because you think a company has bad fundamentals doesn’t mean that’s actually the case. And even if it is, you don’t know if/when the market has already priced it all in. So for us, that information is just a distraction from price, where we focus all our attention. Certain patterns will identify when this change occurs and we will touch on that a bit later.
- Technicals cut through most of the overall chatter about an individual stock summary. The 10Q, FCF, earnings guidance, etc. The technicals already reflect all this combined information in PRICE. And in PRICE there is wisdom. We know PRICE at the end of the day is all that matters. It is not revised every month like most economic indicators. The PRICE is the market summation of participants' wisdom.
- Again the fundamentals in the long term are all that matters, but there is wisdom in the trend and what we attempt to do is capture the meat of that move. The technicals are always listening to the market, whereas the fundamentals are usually talking to the market telling it what it believes it should do. But keep in mind we should not believe in anyone's opinions, even my own, as PRICE is the ultimate arbiter and how we are paid. PRICE is the one thing we can not objectively argue about. PRICE is truth.
- This all being said I believe both the technicals and fundamentals complement each other. I always believed in the saying the fundamentals tell you what to buy and the technicals tell you WHEN to buy. Technicals are just another tool in the overall shed and we are all trying to achieve the same goal, but have different ways of going about it.
- And the most important piece of technical analysis is that it is the only form of investing where you know you are wrong, but at that time you likely will not yet know why. Good risk management is indispensable. In fact, technical analysis was developed centuries ago as there was no reliable source of fundamental information and stocks were regularly manipulated, and using inside information was not illegal. Of course, this was all prior to computers, and charting was all done by hand and classical patterns were born that we will talk about later.
- We are all closet technicians. The first thing when someone asks about a company is to pull up the stock chart. It is a visual representation.
MY PROCESS:
Bottoms-Up Method/Best Of Breed Approach:
- I consider myself a bottoms-up type of investor as opposed to a top-down. For sure I want to have a general view of the entire macro landscape and the like, but for me the bottoms-up view lets me see the individual trees from the huge forest. I recently read a quote from Sam Zell who said when he compares the top-down to the bottoms-up approach he takes the latter. Succinctly he said, "know the streets." Surely he was talking about real estate but my interpretation of that from a technical standpoint was to know the individual companies, realize the very best of breed, and focus your time and capital on those distinct names that deserve it.
Relative Strength/Ratio Charts:
- The way we can capture the creme of the crop stocks is through relative strength. Technical analysis is much more than charts. To use the baseball analogy if a team was trying to win a World Series you would play your All-Stars, not your triple-A ball players. So my approach is, to begin with the current strongest sectors and then drill down to which names are the best actors within the already firmest groups. Ratio charts are very useful in determining this. One can compare an individual stock to its sector and then drill down even further to contrast particular stocks against one another.
Candlesticks:
- Once we have identified the "generals" in their distinct groups we can often determine to better time our entries or exits through bottoming or topping with candlesticks. These are very useful to help establish new positions or help trade around core positions. They enable one to harvest partial profits when a pattern is implying some fatigue to the upside in regards to a PRICE pattern and vice versa when a name is weakening. The technicals are quicker and some formations are adept at honing in on possible changes in the prevailing trend.
- Why do candlesticks work? Most technical patterns, including candlesticks, are driven by investor psychology. Fear and greed which haven't changed for millenuims. Many algorithms are keying in on such technical patterns. These formations represent the ebbs and flows of market participant's psyches.
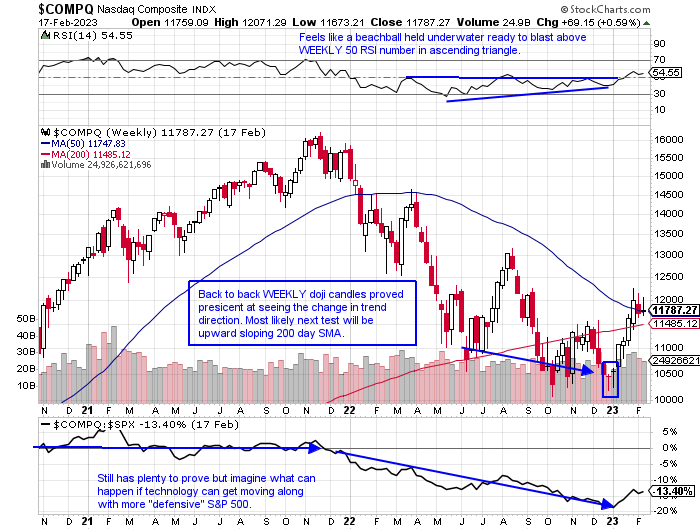
Doji Candles:
- These types of candles are rare and here is an example of back-to-back WEEKLY doji candles on the Nasdaq. If one or more happen in the same relative area it boosts the performance of the signal. Dojis represent great uncertainty.
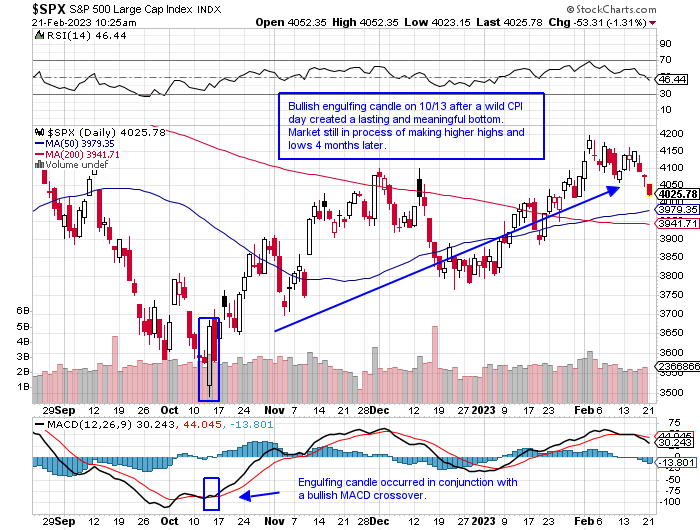
Bullish/Bearish Engulfing:
- In Q4 '22 the markets gave a "shot across the bow" if you will when on the 13th of October many stocks and indexes provided a clear indication that selling pressure was abating as stocks reversed on bad fundamental news. Big test coming up for the most widely watched benchmark just below the very round 4000 number.
Bullish Morning Star:
- Candle patterns that take longer than 1 session carry more importance than ones that do not. Below is an example of the bullish morning star (upward reversal pattern) that requires a move lower the middle session is one of indecision and the final candle should be a robust move with a large white body preferably on heavy volume. There is an evening star pattern that is exactly the opposite which occurs near trend tops.
Other Classical Chart Patterns:
Island Reversals:
- This is a pattern that happens with a fierce gap down scaring many weak holders out near an inflection point low and then several sessions later will complete with a gap up. It often leads to a PRICE rise as all the feeble hands have been shaken out and the path to least resistance is higher. They can also happen at important market tops.
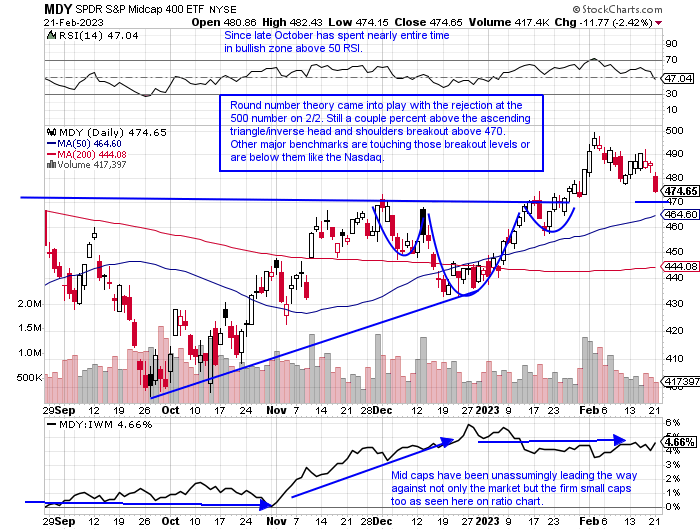
Ascending Triangle:
- The ascending triangle is a formation that should take a longer time to form. It is a pattern with a line or horizontal resistance that eventually gives way after sellers become less relevant as the chart makes higher lows on its way toward a possible breakout above the resistance. For this formation to be considered valid one wants at least 3 touches of the horizontal resistance.
Gap Fills:
- The adage goes most gaps are filled. This is self-explanatory with PRICE coming back to a former gap. One does not want to see this type of trade take to long once the gap is filled. PRICE should rise fairly quickly after the fill. If it happens in conjunction with a former area of support even better. Here with HIG notice the rising 50-day SMA just underneath.
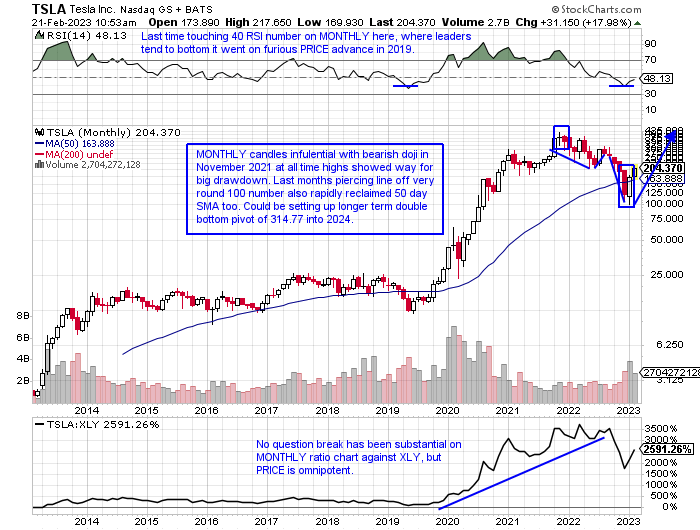
Round Number Theory:
- This is where the stock will find support or resistance at a very round figure. Some round numbers are more influential than others. Par happens to be one of them and the MONTHLY chart below of TSLA demonstrates this. 90 is another essential figure as stocks that originally trade through 90 go on to reach par and beyond.
- All these formations will tend to occur at potential major inflection points. And they give excellent risk/reward signals as if these patterns are negated by a quick, graceful exit will spare investor capital, both physical and mental.
Risk Management:
- Keep it simple. I have found in my career that the best trades/investments are often the ones that work out right away. Often if the train pulls back to the station (proverbial for "after the breakout") there is something wrong with the train.
- I use the strict 6-7% rule as a hard stop loss on all trades as I know I will need 7-8% gain to offset that loss. Obviously, that ratio gets more drastic with a loss of 50% needing a 100% gain to break even.
- Preservation of capital is imperative and trade infrequently. "For investors as a whole returns decrease when motion increases." -Warren Buffett
Process/Philosophy:
Why Technical Analysis Matters:
"Although there are good and bad companies, there is no such thing as a good stock; there are only good stock prices, which come and go." Ben Graham
- First and foremost the market is the best fundamental analyst on the planet. Over the long term fundamentals are all that matter. Trends are fundamental. Charts are fundamental. Great stocks trend higher because they have strong fundamentals. Conversely, weak stocks trend lower because of their weak fundamentals.
- The value in technical analysis is that it is quicker to pick up on changes in the underlying fundamental factors. Again over a one-year period, the fundamentals are imperative, but stocks will turn technically at tops and bottoms well before, as they anticipate changes in the fundamentals. The fundamentals take time to catch up to the technicals. Just because you think a company has bad fundamentals doesn’t mean that’s actually the case. And even if it is, you don’t know if/when the market has already priced it all in. So for us, that information is just a distraction from price, where we focus all our attention. Certain patterns will identify when this change occurs and we will touch on that a bit later.
- Technicals cut through most of the overall chatter about an individual stock summary. The 10Q, FCF, earnings guidance, etc. The technicals already reflect all this combined information in PRICE. And in PRICE there is wisdom. We know PRICE at the end of the day is all that matters. It is not revised every month like most economic indicators. The PRICE is the market summation of participants' wisdom.
- Again the fundamentals in the long term are all that matters, but there is wisdom in the trend and what we attempt to do is capture the meat of that move. The technicals are always listening to the market, whereas the fundamentals are usually talking to the market telling it what it believes it should do. But keep in mind we should not believe in anyone's opinions, even my own, as PRICE is the ultimate arbiter and how we are paid. PRICE is the one thing we can not objectively argue about. PRICE is truth.
- This all being said I believe both the technicals and fundamentals complement each other. I always believed in the saying the fundamentals tell you what to buy and the technicals tell you WHEN to buy. Technicals are just another tool in the overall shed and we are all trying to achieve the same goal, but have different ways of going about it.
- And the most important piece of technical analysis is that it is the only form of investing where you know you are wrong, but at that time you likely will not yet know why. Good risk management is indispensable. In fact, technical analysis was developed centuries ago as there was no reliable source of fundamental information and stocks were regularly manipulated, and using inside information was not illegal. Of course, this was all prior to computers, and charting was all done by hand and classical patterns were born that we will talk about later.
- We are all closet technicians. The first thing when someone asks about a company is to pull up the stock chart. It is a visual representation.
MY PROCESS:
Bottoms-Up Method/Best Of Breed Approach:
- I consider myself a bottoms-up type of investor as opposed to a top-down. For sure I want to have a general view of the entire macro landscape and the like, but for me the bottoms-up view lets me see the individual trees from the huge forest. I recently read a quote from Sam Zell who said when he compares the top-down to the bottoms-up approach he takes the latter. Succinctly he said, "know the streets." Surely he was talking about real estate but my interpretation of that from a technical standpoint was to know the individual companies, realize the very best of breed, and focus your time and capital on those distinct names that deserve it.
Relative Strength/Ratio Charts:
- The way we can capture the creme of the crop stocks is through relative strength. Technical analysis is much more than charts. To use the baseball analogy if a team was trying to win a World Series you would play your All-Stars, not your triple-A ball players. So my approach is, to begin with the current strongest sectors and then drill down to which names are the best actors within the already firmest groups. Ratio charts are very useful in determining this. One can compare an individual stock to its sector and then drill down even further to contrast particular stocks against one another.
Candlesticks:
- Once we have identified the "generals" in their distinct groups we can often determine to better time our entries or exits through bottoming or topping with candlesticks. These are very useful to help establish new positions or help trade around core positions. They enable one to harvest partial profits when a pattern is implying some fatigue to the upside in regards to a PRICE pattern and vice versa when a name is weakening. The technicals are quicker and some formations are adept at honing in on possible changes in the prevailing trend.
- Why do candlesticks work? Most technical patterns, including candlesticks, are driven by investor psychology. Fear and greed which haven't changed for millenuims. Many algorithms are keying in on such technical patterns. These formations represent the ebbs and flows of market participant's psyches.
Doji Candles:
- These types of candles are rare and here is an example of back-to-back WEEKLY doji candles on the Nasdaq. If one or more happen in the same relative area it boosts the performance of the signal. Dojis represent great uncertainty.
Bullish/Bearish Engulfing:
- In Q4 '22 the markets gave a "shot across the bow" if you will when on the 13th of October many stocks and indexes provided a clear indication that selling pressure was abating as stocks reversed on bad fundamental news. Big test coming up for the most widely watched benchmark just below the very round 4000 number.
Bullish Morning Star:
- Candle patterns that take longer than 1 session carry more importance than ones that do not. Below is an example of the bullish morning star (upward reversal pattern) that requires a move lower the middle session is one of indecision and the final candle should be a robust move with a large white body preferably on heavy volume. There is an evening star pattern that is exactly the opposite which occurs near trend tops.
Other Classical Chart Patterns:
Island Reversals:
- This is a pattern that happens with a fierce gap down scaring many weak holders out near an inflection point low and then several sessions later will complete with a gap up. It often leads to a PRICE rise as all the feeble hands have been shaken out and the path to least resistance is higher. They can also happen at important market tops.
Ascending Triangle:
- The ascending triangle is a formation that should take a longer time to form. It is a pattern with a line or horizontal resistance that eventually gives way after sellers become less relevant as the chart makes higher lows on its way toward a possible breakout above the resistance. For this formation to be considered valid one wants at least 3 touches of the horizontal resistance.
Gap Fills:
- The adage goes most gaps are filled. This is self-explanatory with PRICE coming back to a former gap. One does not want to see this type of trade take to long once the gap is filled. PRICE should rise fairly quickly after the fill. If it happens in conjunction with a former area of support even better. Here with HIG notice the rising 50-day SMA just underneath.
Round Number Theory:
- This is where the stock will find support or resistance at a very round figure. Some round numbers are more influential than others. Par happens to be one of them and the MONTHLY chart below of TSLA demonstrates this. 90 is another essential figure as stocks that originally trade through 90 go on to reach par and beyond.
- All these formations will tend to occur at potential major inflection points. And they give excellent risk/reward signals as if these patterns are negated by a quick, graceful exit will spare investor capital, both physical and mental.
Risk Management:
- Keep it simple. I have found in my career that the best trades/investments are often the ones that work out right away. Often if the train pulls back to the station (proverbial for "after the breakout") there is something wrong with the train.
- I use the strict 6-7% rule as a hard stop loss on all trades as I know I will need 7-8% gain to offset that loss. Obviously, that ratio gets more drastic with a loss of 50% needing a 100% gain to break even.
- Preservation of capital is imperative and trade infrequently. "For investors as a whole returns decrease when motion increases." -Warren Buffett