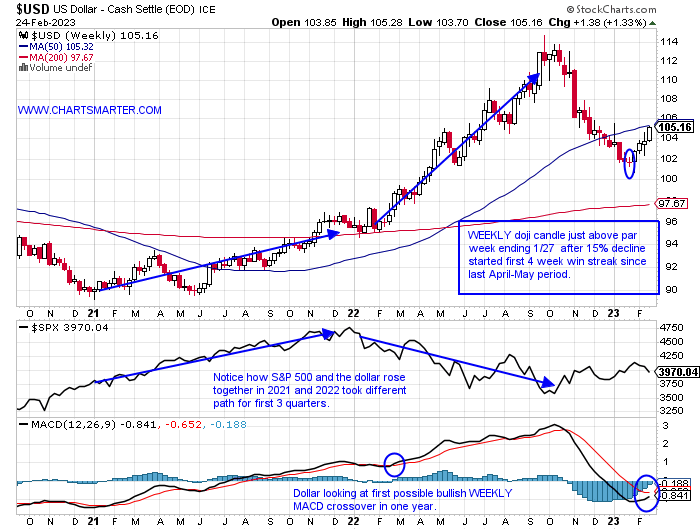
King Dollar:
- The greenback is on the move again, upward this time. After a bearish WEEKLY shooting star candle below to end Q3 2022, the dollar never went higher. Fast forward to the 3 weeks ending 1/13-27 which all CLOSED very tautly (those same 3 weeks the UUP CLOSED within just 3 pennies), all within just .23 of each other and we know that type of tight consolidation often leads to violent moves. The fact that the week ending 1/27 was a doji which is adept at signaling a trend change from the prevailing direction was even more reason to believe the prior selling pressure was genuinely abating. Since the start of 2022, opposite from 2021, the dollar and the S&P 500 have been trading in an inverse fashion. Will we return to the regime of 2021 where both rose together? Most likely not and on the USD MONTHLY chart one would see how persuasive the par number was dating back to 2015. On its daily chart since the bullish piercing line candle on 2/2 as the dollar rose the S&P 500 faltered. On all 3 time frames, the dollar looks compelling. Will the WEEKLY 50 SMA give the market a reprieve here? Next week's candle should be very informative in the direction of the dollar into the first half of 2023.
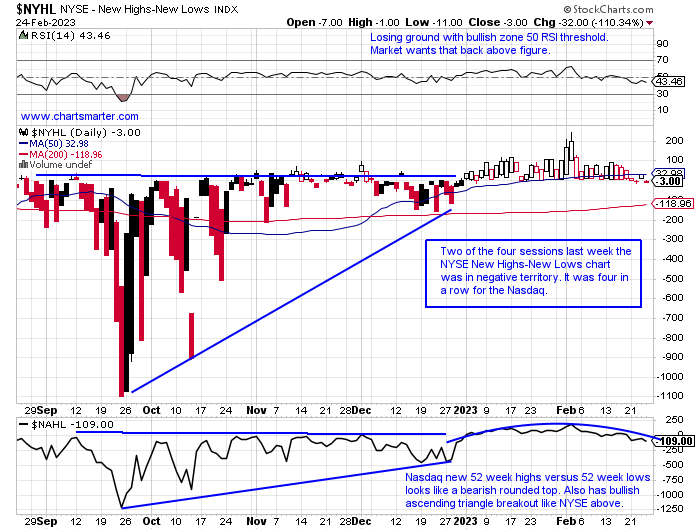
Better New 52-Week Highs Vs. Lows Gauge?
- Last week I put up the chart of the Nasdaq New 52 Week Highs Versus Lows and this week I decided to look at the same chart but with the NYSE. As I glanced this week through the Nasdaq list, which was negative every day last week, I was dismayed by what I saw. For example, on Friday the tally was 35 new highs against 104 new lows. When I glanced at the new lows 26 of the 104 were below $1, and another 15 of the 104 traded with a 1 handle, not exactly the types of names we want to make a determination regarding potential market direction (to be fair there were a couple of real laggards on the new low Nasdaq list with AKAM now on a 3-week losing streak that dropped a combined 20% and AUDC now 43% below its most recent 52 week high). The chart below of the NYSE's new highs and lows is staying near the UNCH mark after its own break above a bullish ascending triangle. For sure it is benefitting from banks, energy and material plays holding up better than tech.
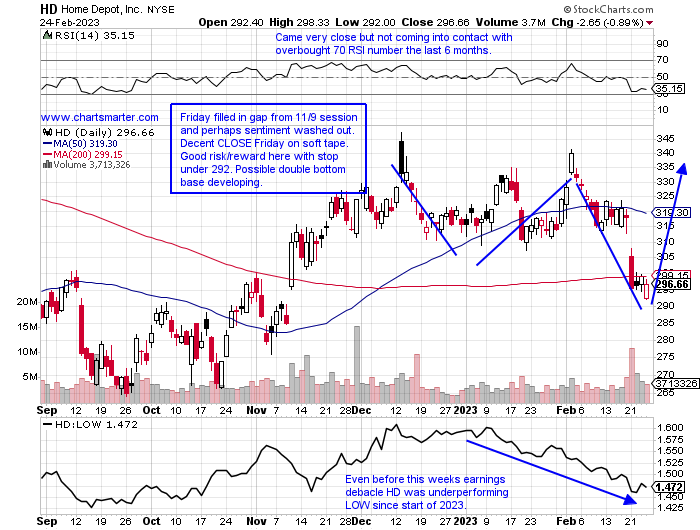
Consumer Concern:
- Earnings continue to come in and last week we got a good glimpse into the consumer. Tuesday before the open WMT, which is classified as a consumer staple, gave a soft outlook but give it credit for shrugging off early weakness to advance fractionally by .6%. HD was not able to accomplish that same feat dropping by 7.1% for its first negative earnings reaction in its last four. Rival LOW will REPORT Tuesday morning before the opening and we will see if this is something company-specific or more systematic. A couple of casual diners fell by double digits with BROS and DPZ slipping by 10.4 and 11.6% respectively, but to be fair best in breed player WING added almost 8%, even as it recorded a bearish shooting star that CLOSED 15 handles off intraday highs Wednesday. Perhaps the biggest joke was the reception BYND enjoyed briefly touching almost 23 before CLOSING 17.4% off its own intraday peak. This name seems allergic to CLOSING above the very round 20 number, with a prior bearish harami cross completed there on 2/3.
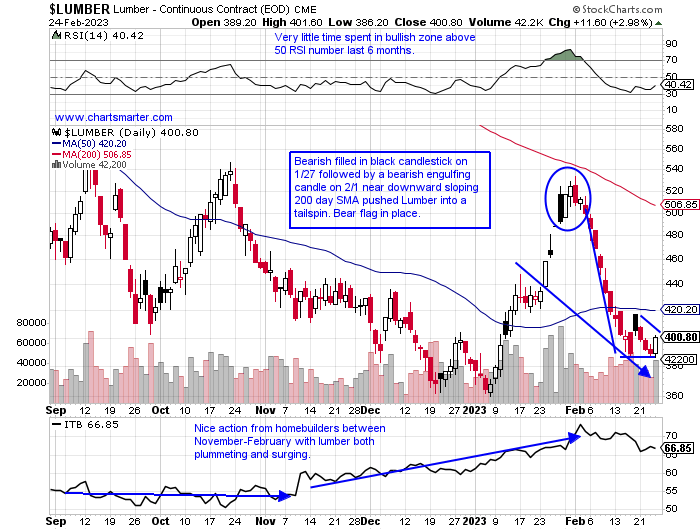
Timberrrrrrr........
- Can I sniff a sense of deflation? Certainly, that is not the word on many minds these days, but the chart below of lumber shows a steep 28% haircut from the top to the bottom of the range from the start of February to present. And that was after a huge rally in January. It is now sporting a bear flag formation but Friday registered a bullish engulfing candle. If one was to look back on its MONTHLY chart to see the same type of violent trade one would see a very similar pattern that occurred in August and September 2020. August screamed higher by 40.3% and September slumped by 28.5%. Fast forward to this January and lumber jumped 36.3% and February with 2 sessions left is lower by 23.6%. November 2020 started a huge rally from essentially 500-1700. Deja vu? Doubtfully but that would likely have a dramatic effect on the homebuilders, which have behaved brilliantly since the bullish engulfing candle on 10/21/22.
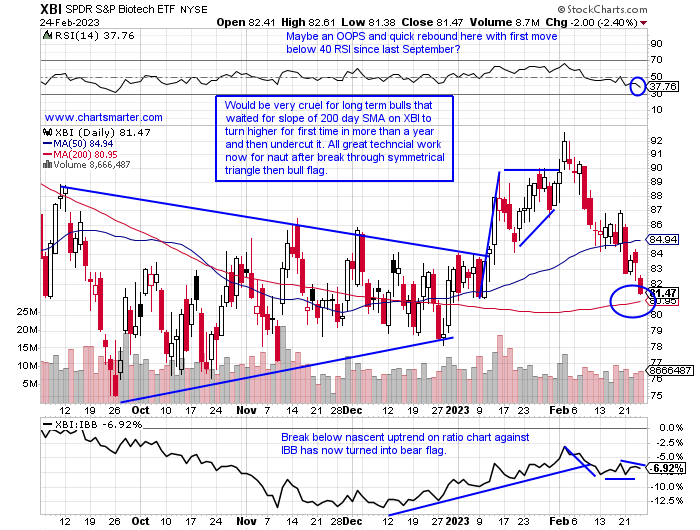
Biotechs Last Stand?
- Patient bulls may be getting their chance from a solid risk/reward stance for entry on the XBI. The slope of the 200-day SMA, which many use as confirmation of the long-term trend being positive or negative has gently turned upward. Investors that have been confident about the space have really been hit in the gut lately. A promising break above a symmetrical triangle and then a subsequent bull flag was inspiring. Of course, the latter was a red flag when the breakout failed so rapidly. Over the last month period, bright spots have been few and far between. SGEN broke above a 140 bullish inverse head and shoulders pivot following a well-received earnings reaction and is now bull flagging. REGN recorded a bearish shooting star at the 800 figure on 2/6 but is still above a 747.80 double-bottom breakout pivot. More of the norm is VRTX breaking below a bear flag at 290, or INCY reversing course after a good-looking cup base breakout. Or BMRN higher just 4 sessions in February, or ALNY cracking lower by 15%. I think you get the picture. Let's take a look below at 2 names that are near influential prior buy points in NBIX and HALO.
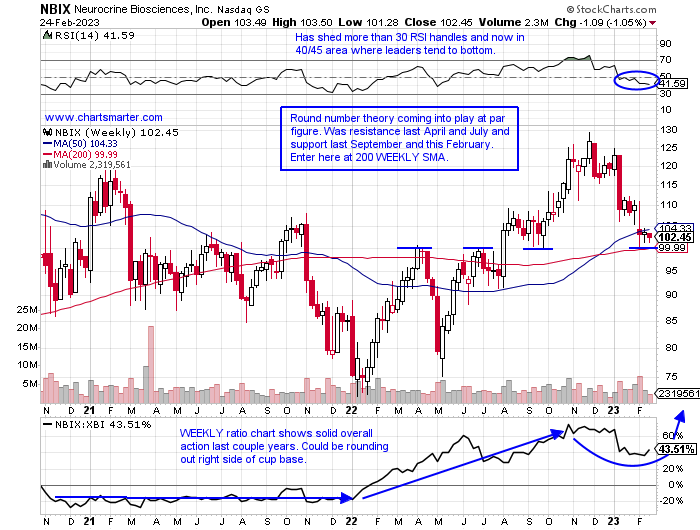
Neurocrine Biosciences:
- Biotech play down 14% YTD and up 18% over last one year period.
- Name 21% off most recent 52-week highs and big distribution with weeks ending 1/13 and 2/10 falling 11.4 and 6.2% respectively. Has not recorded back-to-back WEEKLY gains in 3 months.
- Earnings mixed up 3.7 and 8.4% on 11/1 and 8/5 and losses of 4.5 and .3% on 2/6 and 5/4/22.
- Enter after move back into very round number.
- Entry NBIX here. Stop 95.
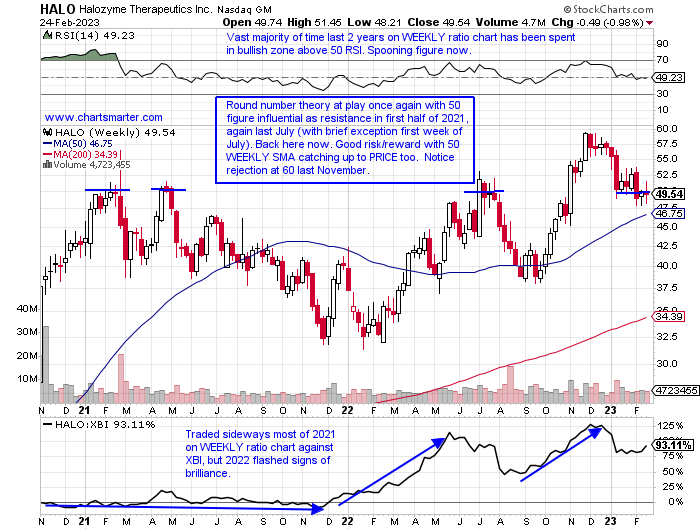
Halozyme Therapeutics:
- Biotech name down 13% YTD and up 40% over last one year period.
- Name 17% off most recent 52-week highs and lower 8 of last 12 weeks including large WEEKLY losses of 9.3 and 7.1% weeks ending 1/13 and 2/10. Has now given back half of impressive 8 of 10 week win streak weeks ending 9/30-12/2/22.
- FOUR straight positive earnings reactions (7 total) up .8, 8.5, 1.8, and 1% on 2/22, 11/9, 8/10, and 5/11/22.
- Enter after pullback to familiar resistance.
- Entry HALO here. Stop 45.
Good luck.
This article requires a Chartsmarter membership. Please click here to join.
King Dollar:
- The greenback is on the move again, upward this time. After a bearish WEEKLY shooting star candle below to end Q3 2022, the dollar never went higher. Fast forward to the 3 weeks ending 1/13-27 which all CLOSED very tautly (those same 3 weeks the UUP CLOSED within just 3 pennies), all within just .23 of each other and we know that type of tight consolidation often leads to violent moves. The fact that the week ending 1/27 was a doji which is adept at signaling a trend change from the prevailing direction was even more reason to believe the prior selling pressure was genuinely abating. Since the start of 2022, opposite from 2021, the dollar and the S&P 500 have been trading in an inverse fashion. Will we return to the regime of 2021 where both rose together? Most likely not and on the USD MONTHLY chart one would see how persuasive the par number was dating back to 2015. On its daily chart since the bullish piercing line candle on 2/2 as the dollar rose the S&P 500 faltered. On all 3 time frames, the dollar looks compelling. Will the WEEKLY 50 SMA give the market a reprieve here? Next week's candle should be very informative in the direction of the dollar into the first half of 2023.
Better New 52-Week Highs Vs. Lows Gauge?
- Last week I put up the chart of the Nasdaq New 52 Week Highs Versus Lows and this week I decided to look at the same chart but with the NYSE. As I glanced this week through the Nasdaq list, which was negative every day last week, I was dismayed by what I saw. For example, on Friday the tally was 35 new highs against 104 new lows. When I glanced at the new lows 26 of the 104 were below $1, and another 15 of the 104 traded with a 1 handle, not exactly the types of names we want to make a determination regarding potential market direction (to be fair there were a couple of real laggards on the new low Nasdaq list with AKAM now on a 3-week losing streak that dropped a combined 20% and AUDC now 43% below its most recent 52 week high). The chart below of the NYSE's new highs and lows is staying near the UNCH mark after its own break above a bullish ascending triangle. For sure it is benefitting from banks, energy and material plays holding up better than tech.
Consumer Concern:
- Earnings continue to come in and last week we got a good glimpse into the consumer. Tuesday before the open WMT, which is classified as a consumer staple, gave a soft outlook but give it credit for shrugging off early weakness to advance fractionally by .6%. HD was not able to accomplish that same feat dropping by 7.1% for its first negative earnings reaction in its last four. Rival LOW will REPORT Tuesday morning before the opening and we will see if this is something company-specific or more systematic. A couple of casual diners fell by double digits with BROS and DPZ slipping by 10.4 and 11.6% respectively, but to be fair best in breed player WING added almost 8%, even as it recorded a bearish shooting star that CLOSED 15 handles off intraday highs Wednesday. Perhaps the biggest joke was the reception BYND enjoyed briefly touching almost 23 before CLOSING 17.4% off its own intraday peak. This name seems allergic to CLOSING above the very round 20 number, with a prior bearish harami cross completed there on 2/3.
Timberrrrrrr........
- Can I sniff a sense of deflation? Certainly, that is not the word on many minds these days, but the chart below of lumber shows a steep 28% haircut from the top to the bottom of the range from the start of February to present. And that was after a huge rally in January. It is now sporting a bear flag formation but Friday registered a bullish engulfing candle. If one was to look back on its MONTHLY chart to see the same type of violent trade one would see a very similar pattern that occurred in August and September 2020. August screamed higher by 40.3% and September slumped by 28.5%. Fast forward to this January and lumber jumped 36.3% and February with 2 sessions left is lower by 23.6%. November 2020 started a huge rally from essentially 500-1700. Deja vu? Doubtfully but that would likely have a dramatic effect on the homebuilders, which have behaved brilliantly since the bullish engulfing candle on 10/21/22.
Biotechs Last Stand?
- Patient bulls may be getting their chance from a solid risk/reward stance for entry on the XBI. The slope of the 200-day SMA, which many use as confirmation of the long-term trend being positive or negative has gently turned upward. Investors that have been confident about the space have really been hit in the gut lately. A promising break above a symmetrical triangle and then a subsequent bull flag was inspiring. Of course, the latter was a red flag when the breakout failed so rapidly. Over the last month period, bright spots have been few and far between. SGEN broke above a 140 bullish inverse head and shoulders pivot following a well-received earnings reaction and is now bull flagging. REGN recorded a bearish shooting star at the 800 figure on 2/6 but is still above a 747.80 double-bottom breakout pivot. More of the norm is VRTX breaking below a bear flag at 290, or INCY reversing course after a good-looking cup base breakout. Or BMRN higher just 4 sessions in February, or ALNY cracking lower by 15%. I think you get the picture. Let's take a look below at 2 names that are near influential prior buy points in NBIX and HALO.
Neurocrine Biosciences:
- Biotech play down 14% YTD and up 18% over last one year period.
- Name 21% off most recent 52-week highs and big distribution with weeks ending 1/13 and 2/10 falling 11.4 and 6.2% respectively. Has not recorded back-to-back WEEKLY gains in 3 months.
- Earnings mixed up 3.7 and 8.4% on 11/1 and 8/5 and losses of 4.5 and .3% on 2/6 and 5/4/22.
- Enter after move back into very round number.
- Entry NBIX here. Stop 95.
Halozyme Therapeutics:
- Biotech name down 13% YTD and up 40% over last one year period.
- Name 17% off most recent 52-week highs and lower 8 of last 12 weeks including large WEEKLY losses of 9.3 and 7.1% weeks ending 1/13 and 2/10. Has now given back half of impressive 8 of 10 week win streak weeks ending 9/30-12/2/22.
- FOUR straight positive earnings reactions (7 total) up .8, 8.5, 1.8, and 1% on 2/22, 11/9, 8/10, and 5/11/22.
- Enter after pullback to familiar resistance.
- Entry HALO here. Stop 45.
Good luck.