"When you are the underdog you just lay low and work" -Russell 2000
Does Size Really Matter?
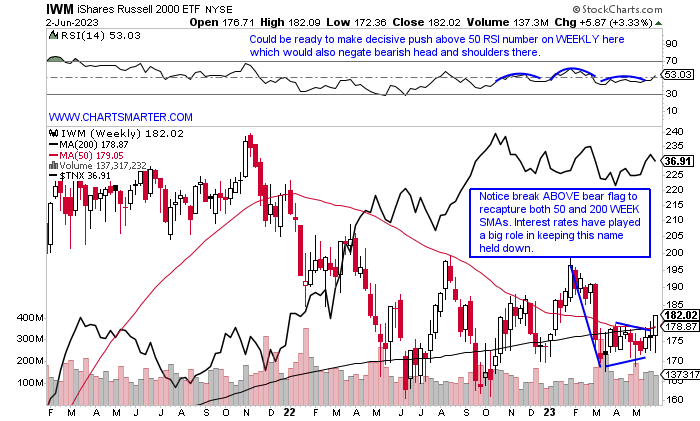
- A theme in this WEEK AHEAD Note will be if participation is starting to expand. Here we will take a look at the WEEKLY chart of the IWM, which represents small caps and it had a banner week rising 3.3% well outperforming the other big three major benchmarks. Before we get too excited the IWM is still 10% off most recent 52-week highs, but some green shoots are appearing. Friday it recouped both its 50 and 200-day SMAs and broke above a tight range between the round 170-180 numbers, and that 170 level was key as it was the neckline in a bearish head and shoulders pattern. Contributing to its vigor this week was the softness in the 10-year yield which we overlapped on the chart below. Interest rates obviously affect small caps to a larger degree as they are dependent on financing their operations as they grow. Respect the IWM breaking ABOVE the bear flag and could a move to the very round 200 number be in play like it was last August and this February? Before we get too excited let's recall the huge breakout in November 2021 that jumped above a flat base rising 6% in robust trade only to be followed immediately by the start of a bearish three-black crows pattern which started a long dark descent it is still recuperating from.
New Highs "Widening":
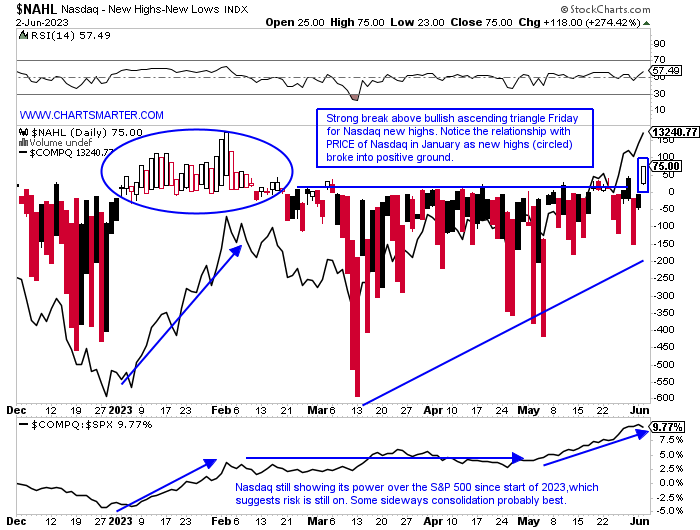
- The Nasdaq last week rose more than 2% CLOSING above the very round 13000 number, and recording its first 6-week winning streak since the end of 2019 and the start of 2020. The tech-heavy benchmark has not lost on a back-to-back WEEKLY basis since the start of 2023. And those that have been complaining about the lack of breadth, either have to give up that argument or come up with a new bearish stance. The chart below of the new Nasdaq highs broke out Friday above a bullish ascending triangle and notice how when that last occurred in January the index soared to its best advance in a couple of decades. Stocks that are outside of the S&P 5 that made the list Friday include AEHR, CFLT, CTAS, EXTR, and HLIT for example. Cintas is at all-time highs, a good sign as it is a name that has a good pulse on small businesses around the country. The "widening" reference is for Secretariat on his 50th anniversary of winning the Belmont Stakes today. Can still hear "he is widening now, he is moving like a tremendous machine". Kind of like the Nasdaq at the moment.
Steely Nerves:
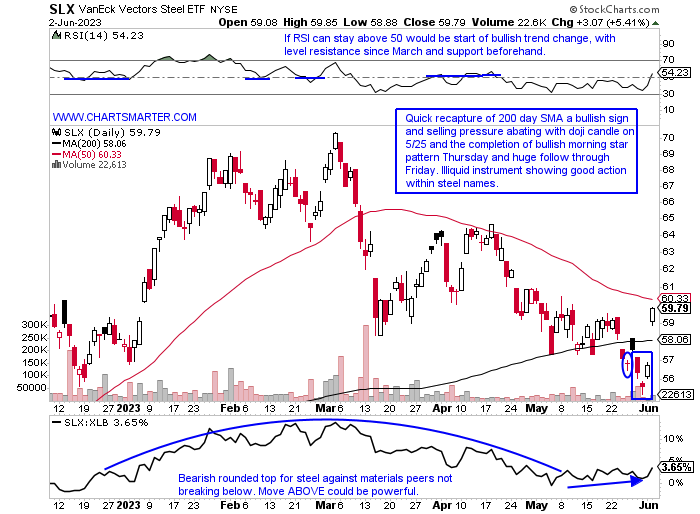
- A strong job number Friday boosted a lot of cyclical sectors, giving technology a well-needed, and deserved break (Friday tech and communication services were the "worst" performers up less than 1%). The XLB jumped more than 3%, aided by a strong showing in steel stocks. One day certainly does not make a trend, but if groups like this continue to advance recession chatter will be relegated to the back pages. The SLX on Friday recorded its best gain since 11/4/22 rising 5.4%. Similarities with both of those days saw the ETF CLOSE above its 200-day SMA, and the November example witnessed a nice PRICE move into the round 70 number over the next few months. Demand best in breed as always, and if going domestic that would be ATI which is now honing in on a double bottom pivot of 39.93. It trades just 10% off the most recent 52-week highs compared to peers NUE, X, and CLF which are 23, 30, and 37% from their respective annual peaks. ATI is also now above both its 50 and 200-day SMAs, something which all the aforementioned names can not boast of.
Doji Appearance:
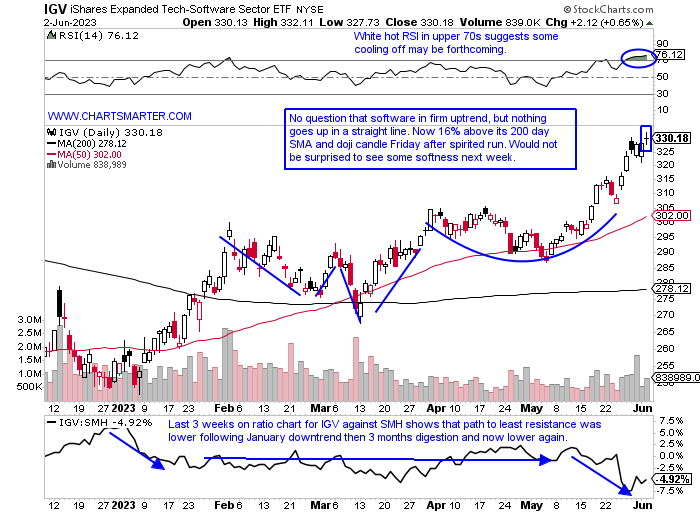
- After falling the first 4 sessions of May software continued its powerful ascent. Since then it has fallen just 6 sessions and went out last week on a 6-day win streak. The ETF is now on a 4-week winning streak with all 4 CLOSING at or very close to highs for the range, with volume increasing each week. The right side of the WEEKLY cup base is being constructed very well but a pause may be upcoming. Its WEEKLY chart recorded a spinning top and below one can see the doji on the day. Its RSI is at an elevated 76. Leaders last week flexing their muscles included MDB and IOT each gaining almost 30% (the latter has produced 3 straight positive double-digit earnings-related advances of at least 15%). Others like PD, AI, GWRE, and OKTA all tumbled between 13-17%. Of course, the big boys will have the most say on the direction of the IGV, and MSFT may need to put a handle on its WEEKLY cup base as it approaches the 340ish level where it last traded in late 2021 (last week registered a bearish hanging man). This group is poised for higher PRICES as we go ahead in 2023 but a prudent pause may occur after the doji Friday.
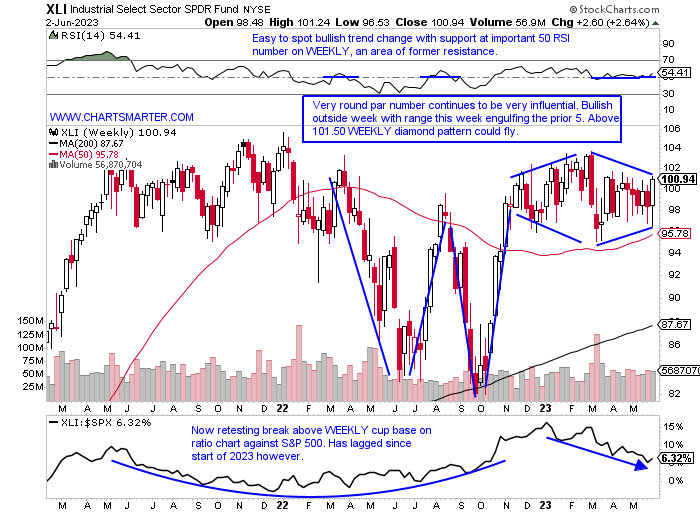
Industrial Revolution:
- Last week every major S&P sector rose which could suggest that the rally is starting to broaden out. Of course, some did more of the heavy lifting than others, but I have always had my eye on the industrials. On a YTD basis, outside of the dominant top 3 in the XLK XLC and XLY, this is the best-behaved higher by a mild 3.2%. Comparing it however to how well it is holding its current altitude against the other 10 major S&P sectors is very admirable. It currently trades just 3% off its most recent 52-week highs, only outdone by the XLC and XLY which are at and 1% off their annual peaks (only 2 others are less than 10% from their 52-week highs in the XLP and XLV). The very round par number has been very sticky and this week was the first CLOSE above it in the last 6 even though the prior 5 were all above 100 intraweek. It is now back above the WEEKLY double-bottom pivot in that area from last November and if top 5 holding BA can break above 220 the XLI can spread its wings, pun intended. Give credit for the ETF hanging tough despite 4 of the top 10 components being near "bear market mode" 20% from their most recent 52-week highs including DE UNP UPS and ADP.
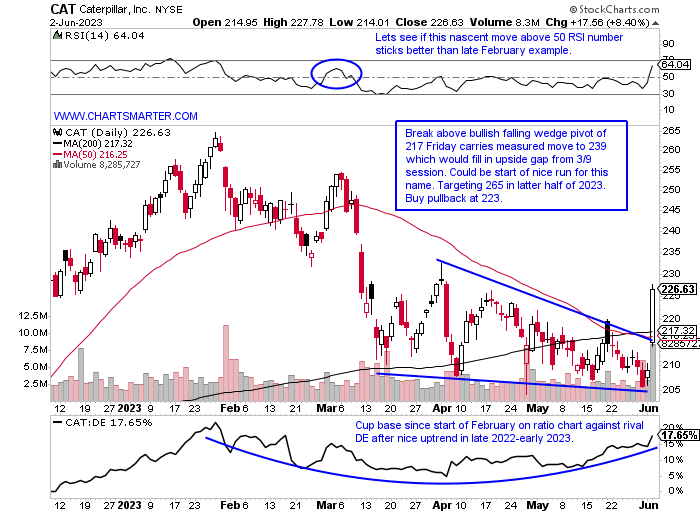
Caterpillar:
- Heavy machinery play down 5% YTD and up 3% over last one year period. Dividend yield of 2.1%.
- Name 15% off most recent 52-week highs and nice gain of 7% this week came on tepid volume. Last week of accumulation came week ending 10/28/22. Has look of breaking ABOVE bear flag on WEEKLY.
- Earnings reactions mostly lower (down 10 of last 12) and off .9, 3.5, and 5.8% on 4/27, 1/31, and 8/2/22 and rose 7.7% on 10/27/22.
- Enter on pullback into bullish falling wedge breakout.
- Entry CAT 223. Stop 209.
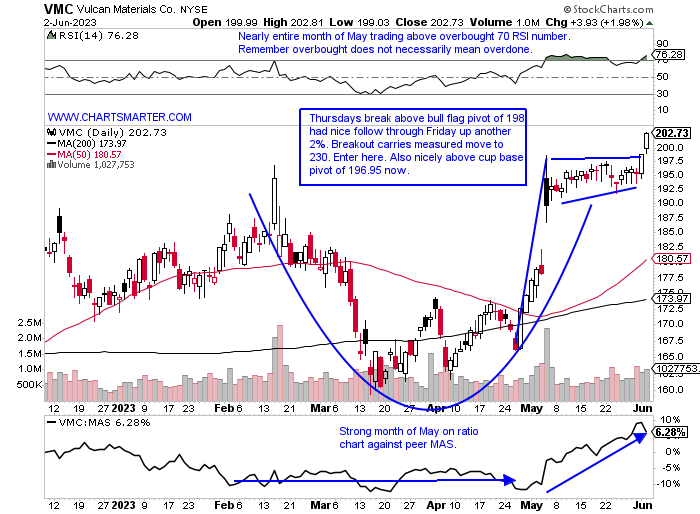
Vulcan Materials:
- Building materials and fixtures play up 16% YTD and 20% over last one-year period. Dividend yield of .8%.
- Name at 52-week highs and week ending 5/5 jumped 10.5%, and good consolidation with 3 weeks immediately after all CLOSING taut within just 1.84 of each other. First WEEKLY CLOSE above very round 200 number since early 2022.
- Earnings reactions mixed up 6.5 and 2.5% on 5/4 and 8/4/22 and fell 5.2 and 1.1% on 2/16 and 11/2/22.
- Enter after break above bull flag.
- Entry VMC here. Stop 192.
Good luck.
This article requires a Chartsmarter membership. Please click here to join.
"When you are the underdog you just lay low and work" -Russell 2000
Does Size Really Matter?
- A theme in this WEEK AHEAD Note will be if participation is starting to expand. Here we will take a look at the WEEKLY chart of the IWM, which represents small caps and it had a banner week rising 3.3% well outperforming the other big three major benchmarks. Before we get too excited the IWM is still 10% off most recent 52-week highs, but some green shoots are appearing. Friday it recouped both its 50 and 200-day SMAs and broke above a tight range between the round 170-180 numbers, and that 170 level was key as it was the neckline in a bearish head and shoulders pattern. Contributing to its vigor this week was the softness in the 10-year yield which we overlapped on the chart below. Interest rates obviously affect small caps to a larger degree as they are dependent on financing their operations as they grow. Respect the IWM breaking ABOVE the bear flag and could a move to the very round 200 number be in play like it was last August and this February? Before we get too excited let's recall the huge breakout in November 2021 that jumped above a flat base rising 6% in robust trade only to be followed immediately by the start of a bearish three-black crows pattern which started a long dark descent it is still recuperating from.
New Highs "Widening":
- The Nasdaq last week rose more than 2% CLOSING above the very round 13000 number, and recording its first 6-week winning streak since the end of 2019 and the start of 2020. The tech-heavy benchmark has not lost on a back-to-back WEEKLY basis since the start of 2023. And those that have been complaining about the lack of breadth, either have to give up that argument or come up with a new bearish stance. The chart below of the new Nasdaq highs broke out Friday above a bullish ascending triangle and notice how when that last occurred in January the index soared to its best advance in a couple of decades. Stocks that are outside of the S&P 5 that made the list Friday include AEHR, CFLT, CTAS, EXTR, and HLIT for example. Cintas is at all-time highs, a good sign as it is a name that has a good pulse on small businesses around the country. The "widening" reference is for Secretariat on his 50th anniversary of winning the Belmont Stakes today. Can still hear "he is widening now, he is moving like a tremendous machine". Kind of like the Nasdaq at the moment.
Steely Nerves:
- A strong job number Friday boosted a lot of cyclical sectors, giving technology a well-needed, and deserved break (Friday tech and communication services were the "worst" performers up less than 1%). The XLB jumped more than 3%, aided by a strong showing in steel stocks. One day certainly does not make a trend, but if groups like this continue to advance recession chatter will be relegated to the back pages. The SLX on Friday recorded its best gain since 11/4/22 rising 5.4%. Similarities with both of those days saw the ETF CLOSE above its 200-day SMA, and the November example witnessed a nice PRICE move into the round 70 number over the next few months. Demand best in breed as always, and if going domestic that would be ATI which is now honing in on a double bottom pivot of 39.93. It trades just 10% off the most recent 52-week highs compared to peers NUE, X, and CLF which are 23, 30, and 37% from their respective annual peaks. ATI is also now above both its 50 and 200-day SMAs, something which all the aforementioned names can not boast of.
Doji Appearance:
- After falling the first 4 sessions of May software continued its powerful ascent. Since then it has fallen just 6 sessions and went out last week on a 6-day win streak. The ETF is now on a 4-week winning streak with all 4 CLOSING at or very close to highs for the range, with volume increasing each week. The right side of the WEEKLY cup base is being constructed very well but a pause may be upcoming. Its WEEKLY chart recorded a spinning top and below one can see the doji on the day. Its RSI is at an elevated 76. Leaders last week flexing their muscles included MDB and IOT each gaining almost 30% (the latter has produced 3 straight positive double-digit earnings-related advances of at least 15%). Others like PD, AI, GWRE, and OKTA all tumbled between 13-17%. Of course, the big boys will have the most say on the direction of the IGV, and MSFT may need to put a handle on its WEEKLY cup base as it approaches the 340ish level where it last traded in late 2021 (last week registered a bearish hanging man). This group is poised for higher PRICES as we go ahead in 2023 but a prudent pause may occur after the doji Friday.
Industrial Revolution:
- Last week every major S&P sector rose which could suggest that the rally is starting to broaden out. Of course, some did more of the heavy lifting than others, but I have always had my eye on the industrials. On a YTD basis, outside of the dominant top 3 in the XLK XLC and XLY, this is the best-behaved higher by a mild 3.2%. Comparing it however to how well it is holding its current altitude against the other 10 major S&P sectors is very admirable. It currently trades just 3% off its most recent 52-week highs, only outdone by the XLC and XLY which are at and 1% off their annual peaks (only 2 others are less than 10% from their 52-week highs in the XLP and XLV). The very round par number has been very sticky and this week was the first CLOSE above it in the last 6 even though the prior 5 were all above 100 intraweek. It is now back above the WEEKLY double-bottom pivot in that area from last November and if top 5 holding BA can break above 220 the XLI can spread its wings, pun intended. Give credit for the ETF hanging tough despite 4 of the top 10 components being near "bear market mode" 20% from their most recent 52-week highs including DE UNP UPS and ADP.
Caterpillar:
- Heavy machinery play down 5% YTD and up 3% over last one year period. Dividend yield of 2.1%.
- Name 15% off most recent 52-week highs and nice gain of 7% this week came on tepid volume. Last week of accumulation came week ending 10/28/22. Has look of breaking ABOVE bear flag on WEEKLY.
- Earnings reactions mostly lower (down 10 of last 12) and off .9, 3.5, and 5.8% on 4/27, 1/31, and 8/2/22 and rose 7.7% on 10/27/22.
- Enter on pullback into bullish falling wedge breakout.
- Entry CAT 223. Stop 209.
Vulcan Materials:
- Building materials and fixtures play up 16% YTD and 20% over last one-year period. Dividend yield of .8%.
- Name at 52-week highs and week ending 5/5 jumped 10.5%, and good consolidation with 3 weeks immediately after all CLOSING taut within just 1.84 of each other. First WEEKLY CLOSE above very round 200 number since early 2022.
- Earnings reactions mixed up 6.5 and 2.5% on 5/4 and 8/4/22 and fell 5.2 and 1.1% on 2/16 and 11/2/22.
- Enter after break above bull flag.
- Entry VMC here. Stop 192.
Good luck.