"Those who can't change their minds can't change anything." - George Bernard Shaw
Taking the Less Sanguine Long-Term Look:
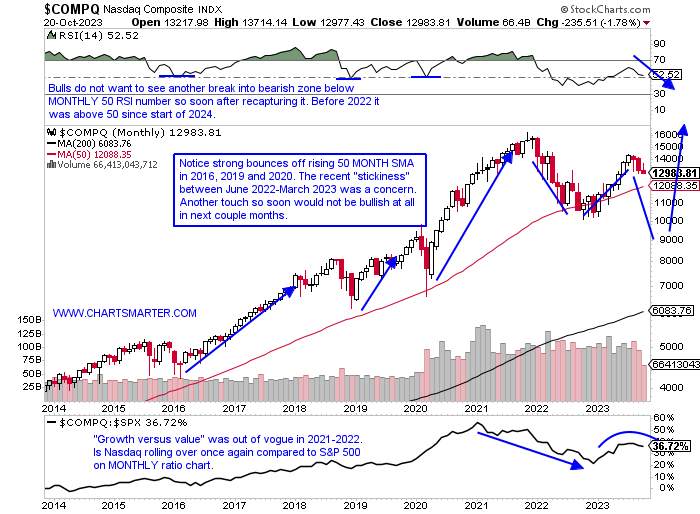
- Being open-minded in life is an excellent trait to have. In markets, it is a good virtue as well. Here we will take a look at what could go wrong with the Nasdaq. It is a small probability, but for sure one that could occur. Below is the MONTHLY chart of the tech benchmark and as there is still time left in October it is looking at a potential rare three-month losing streak (only one other one since the start of 2016). It is certainly plausible that August was a bearish hanging man candle and it could have started a move back into the 50-MONTH SMA, which has been a springboard and a quick stop as it resumed its steady uptrend. That is what had me concerned about sticking like glue to the line for 9 consecutive months and now looks like it may be limping back toward that moving average. If that line is taken out a likely double-bottom pattern could look to develop that would plunge the tech index below the very round 10000 number where it bottomed between last October and this January. Again this is a very low probability but one must stay open-minded too. Remember crashes, a word I have never used in my 15 years of writing, come from oversold, not overbought conditions. Here we look at the S&P 500 daily charts from the 1987 and 2020 time frames.
New Floor?
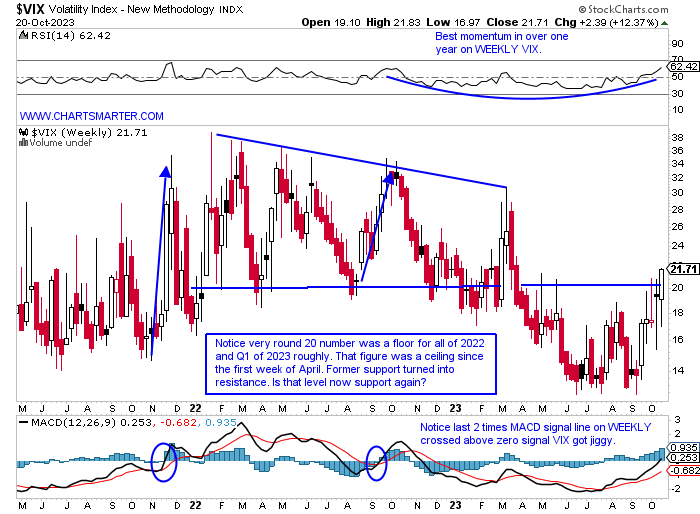
- Once again I will try to convey that technical analysis, through PRICE action, can be applied to the VIX. The instrument could be entering a new regime where it traded above the very round 20 number throughout a tough 2022 for markets. This week it finally CLOSED above the figure, after the prior 2 weeks were above intraweek but failed to finish north of it (it was above 20 the last week of March and first two weeks of April and again for two weeks in May and again could not CLOSE above 20). So this week could have been significant. The VIX seems to be gaining confidence up 4 of the last 5 weeks, and before that, since the start of the year had only advanced 13 weeks. Of course, bears would like to see another WEEKLY CLOSE next week above 20 to reduce the possibility of this being a bull trap. Markets like a "teenager" VIX and notice this week on the WEEKLY chart the MACD signal line crossed back above zero. The last 2 times it did that in late 2021 and summer 2022 it became energetic.
Round Number Theory is a Thing:
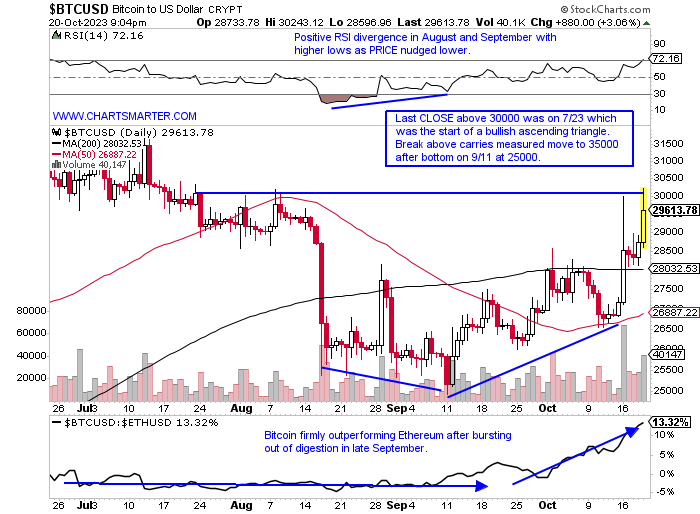
- I like to incorporate round-number theory in my work as it is useful in adding or shaving from core positions, especially if PRICE has memory at certain round levels. Notice on the Russell 2000 Dec emini contract how 1800 was a roadblock, and of course, we all know the "round" 5 area (bearish hanging man candle Thursday) on the 10 year has been spoken about incessantly (Gold at 2000). On the chart below of Bitcoin one can see that it almost feels allergic to the very round 30000 figure. If it can catapult that figure it could be a beach ball held underwater type breakout to the 35000 area. On Monday to start last week it reversed 15000 handles after precisely touching the number. On Friday intraday it was 200 points above 30000 and had a small reversal of 600 handles from the top of the daily range. On an intraday basis, it was above 30000 on 7/24 before CLOSING well under 29000. On 8/2 it was above 30000 again and CLOSED below 29000, and on 8/8-9 it was north of the number only to CLOSE in the lower 29000s.
Nuclear Following Through:
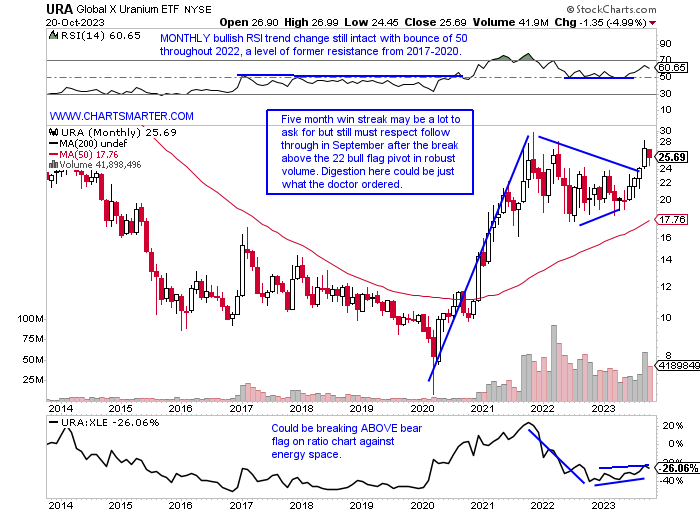
- Investors who have put their money in energy the last few years are happy campers. The XLE is taking a well-deserved breather in 2023 but is still up 6%, but nuclear as judged by the URA is trouncing it higher by 28% so far in 2023. We highlighted this chart one month ago in our 9/18 WEEK AHEAD Note. One may recognize that its chart is very similar to CCJ, which represents almost 1/4 of the fund as its top holding. The stock displayed solid relative strength this week up almost 5%, ending a 4-week losing streak. There are other names in the nuclear space that one should keep an eye on here. BWXT, an industrial leader, has shrugged off any overall market fragilities here as it rests just above a double-bottom breakout pivot of 75.69. It did record a bearish WEEKLY shooting star candle last week but has ignored three other ones since mid-March. CEG completed a bearish three-black crows pattern after a bearish engulfing candle on 10/13. All three of these names are long-term buys in my opinion.
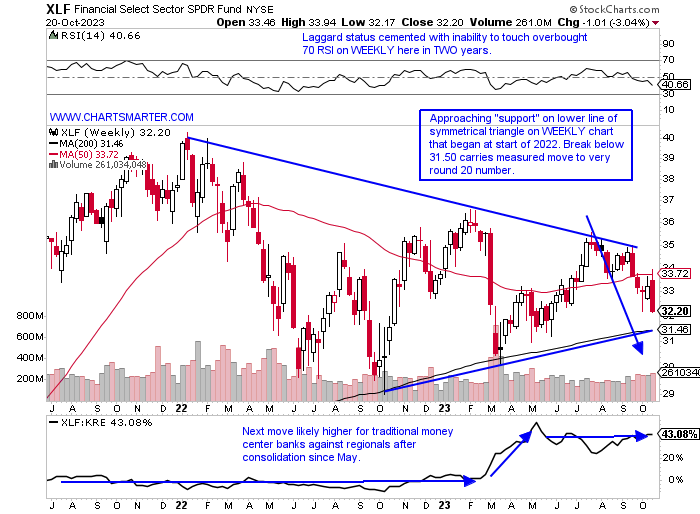
Financials Predicament:
- The financial space, via the XLF, is swiftly moving toward the lower end of a range stuck between the round 30-40 numbers, and the fund has hit the 30 number three times in the summer and fall of 2022 and again in late March. If that level is touched one more time look for the ETF to take the elevator down toward the very round 20 figure, the measured move in a break under a symmetrical triangle. Top-holding BRK/B is now on a rare 5-week losing streak and the last time that occurred was during a consecutive 6-week fall in April-May 2022 during a treacherous decline of 100 handles in a very quick time frame. We witnessed some earnings reactions from several top 10 holdings in JPM on 10/13 which recorded a nasty bearish shooting star candle. It feels to me like it will undercut its 200-day SMA and perhaps form a future double-bottom pattern. C registered the same candle on 10/13 as well and is now 25% from its most recent 52-week highs (JPM is just 10% from its annual peak). BAC which we spoke of recently is the worst of the bunch now at 32% from its heights made last November. Let us look at an opportunity on the long side in MS and the short side in PYPL below.
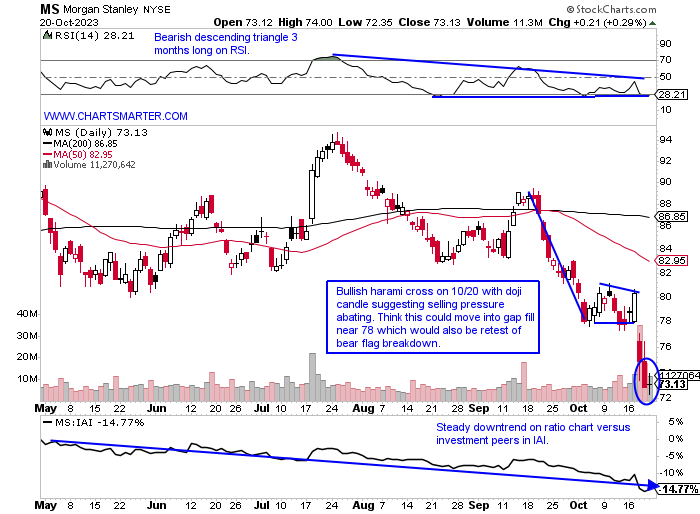
Morgan Stanley:
- Investment services play down 14% YTD and 5% over last one year period. Dividend yield of 4.6%.
- Name 28% off most recent 52-week highs after rejection at par first 3 weeks of February. Current 5-week losing streak with last week slumping 6% on the largest WEEKLY volume since the week ending 1/21/22.
- Earnings reactions mostly higher up 6.4, .7 and 5.9% on 7/18, 4/19, and 1/17 before a recent loss of 6.8% on 10/18.
- Enter after bullish harami cross.
- Entry MS here. Stop 71.
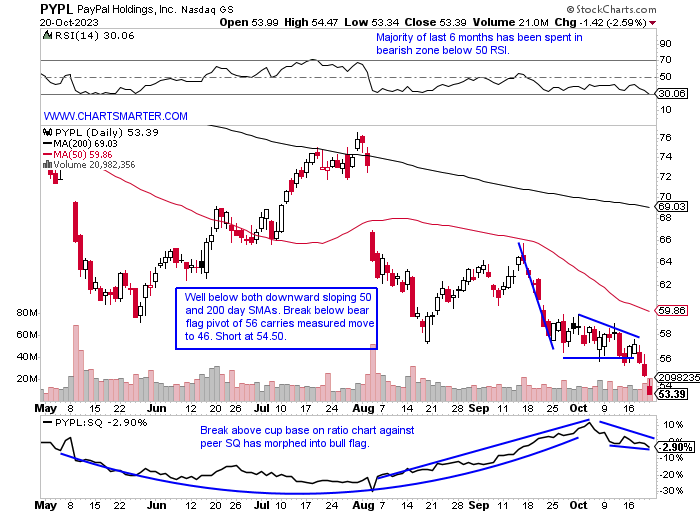
PayPal:
- Payments play down 25% YTD and 37% over last one-year period.
- Name 42% off most recent 52-week highs and has declined 8 of last 12 weeks. Big distribution with huge volume the weeks ending 5/12 and 8/4 which fell 18 and 15% respectively. Big downtrend began with rejection at very round 300 number in summer of 2021 well before overall market began dropping.
- Earnings reactions mostly lower off 12.3, 12.7, and 1.8% on 8/3, 5/9, and 11/4/22 and rose 3% on 2/10.
- Enter on move back into bear flag breakdown.
- Entry PYPL 54.50. Buy stop 57.75 (REPORTS 11/1 after close).
This article requires a Chartsmarter membership. Please click here to join.
"Those who can't change their minds can't change anything." - George Bernard Shaw
Taking the Less Sanguine Long-Term Look:
- Being open-minded in life is an excellent trait to have. In markets, it is a good virtue as well. Here we will take a look at what could go wrong with the Nasdaq. It is a small probability, but for sure one that could occur. Below is the MONTHLY chart of the tech benchmark and as there is still time left in October it is looking at a potential rare three-month losing streak (only one other one since the start of 2016). It is certainly plausible that August was a bearish hanging man candle and it could have started a move back into the 50-MONTH SMA, which has been a springboard and a quick stop as it resumed its steady uptrend. That is what had me concerned about sticking like glue to the line for 9 consecutive months and now looks like it may be limping back toward that moving average. If that line is taken out a likely double-bottom pattern could look to develop that would plunge the tech index below the very round 10000 number where it bottomed between last October and this January. Again this is a very low probability but one must stay open-minded too. Remember crashes, a word I have never used in my 15 years of writing, come from oversold, not overbought conditions. Here we look at the S&P 500 daily charts from the 1987 and 2020 time frames.
New Floor?
- Once again I will try to convey that technical analysis, through PRICE action, can be applied to the VIX. The instrument could be entering a new regime where it traded above the very round 20 number throughout a tough 2022 for markets. This week it finally CLOSED above the figure, after the prior 2 weeks were above intraweek but failed to finish north of it (it was above 20 the last week of March and first two weeks of April and again for two weeks in May and again could not CLOSE above 20). So this week could have been significant. The VIX seems to be gaining confidence up 4 of the last 5 weeks, and before that, since the start of the year had only advanced 13 weeks. Of course, bears would like to see another WEEKLY CLOSE next week above 20 to reduce the possibility of this being a bull trap. Markets like a "teenager" VIX and notice this week on the WEEKLY chart the MACD signal line crossed back above zero. The last 2 times it did that in late 2021 and summer 2022 it became energetic.
Round Number Theory is a Thing:
- I like to incorporate round-number theory in my work as it is useful in adding or shaving from core positions, especially if PRICE has memory at certain round levels. Notice on the Russell 2000 Dec emini contract how 1800 was a roadblock, and of course, we all know the "round" 5 area (bearish hanging man candle Thursday) on the 10 year has been spoken about incessantly (Gold at 2000). On the chart below of Bitcoin one can see that it almost feels allergic to the very round 30000 figure. If it can catapult that figure it could be a beach ball held underwater type breakout to the 35000 area. On Monday to start last week it reversed 15000 handles after precisely touching the number. On Friday intraday it was 200 points above 30000 and had a small reversal of 600 handles from the top of the daily range. On an intraday basis, it was above 30000 on 7/24 before CLOSING well under 29000. On 8/2 it was above 30000 again and CLOSED below 29000, and on 8/8-9 it was north of the number only to CLOSE in the lower 29000s.
Nuclear Following Through:
- Investors who have put their money in energy the last few years are happy campers. The XLE is taking a well-deserved breather in 2023 but is still up 6%, but nuclear as judged by the URA is trouncing it higher by 28% so far in 2023. We highlighted this chart one month ago in our 9/18 WEEK AHEAD Note. One may recognize that its chart is very similar to CCJ, which represents almost 1/4 of the fund as its top holding. The stock displayed solid relative strength this week up almost 5%, ending a 4-week losing streak. There are other names in the nuclear space that one should keep an eye on here. BWXT, an industrial leader, has shrugged off any overall market fragilities here as it rests just above a double-bottom breakout pivot of 75.69. It did record a bearish WEEKLY shooting star candle last week but has ignored three other ones since mid-March. CEG completed a bearish three-black crows pattern after a bearish engulfing candle on 10/13. All three of these names are long-term buys in my opinion.
Financials Predicament:
- The financial space, via the XLF, is swiftly moving toward the lower end of a range stuck between the round 30-40 numbers, and the fund has hit the 30 number three times in the summer and fall of 2022 and again in late March. If that level is touched one more time look for the ETF to take the elevator down toward the very round 20 figure, the measured move in a break under a symmetrical triangle. Top-holding BRK/B is now on a rare 5-week losing streak and the last time that occurred was during a consecutive 6-week fall in April-May 2022 during a treacherous decline of 100 handles in a very quick time frame. We witnessed some earnings reactions from several top 10 holdings in JPM on 10/13 which recorded a nasty bearish shooting star candle. It feels to me like it will undercut its 200-day SMA and perhaps form a future double-bottom pattern. C registered the same candle on 10/13 as well and is now 25% from its most recent 52-week highs (JPM is just 10% from its annual peak). BAC which we spoke of recently is the worst of the bunch now at 32% from its heights made last November. Let us look at an opportunity on the long side in MS and the short side in PYPL below.
Morgan Stanley:
- Investment services play down 14% YTD and 5% over last one year period. Dividend yield of 4.6%.
- Name 28% off most recent 52-week highs after rejection at par first 3 weeks of February. Current 5-week losing streak with last week slumping 6% on the largest WEEKLY volume since the week ending 1/21/22.
- Earnings reactions mostly higher up 6.4, .7 and 5.9% on 7/18, 4/19, and 1/17 before a recent loss of 6.8% on 10/18.
- Enter after bullish harami cross.
- Entry MS here. Stop 71.
PayPal:
- Payments play down 25% YTD and 37% over last one-year period.
- Name 42% off most recent 52-week highs and has declined 8 of last 12 weeks. Big distribution with huge volume the weeks ending 5/12 and 8/4 which fell 18 and 15% respectively. Big downtrend began with rejection at very round 300 number in summer of 2021 well before overall market began dropping.
- Earnings reactions mostly lower off 12.3, 12.7, and 1.8% on 8/3, 5/9, and 11/4/22 and rose 3% on 2/10.
- Enter on move back into bear flag breakdown.
- Entry PYPL 54.50. Buy stop 57.75 (REPORTS 11/1 after close).