"A man should look for what is, and not for what he thinks should be."- Albert Einstein
Size Matters:
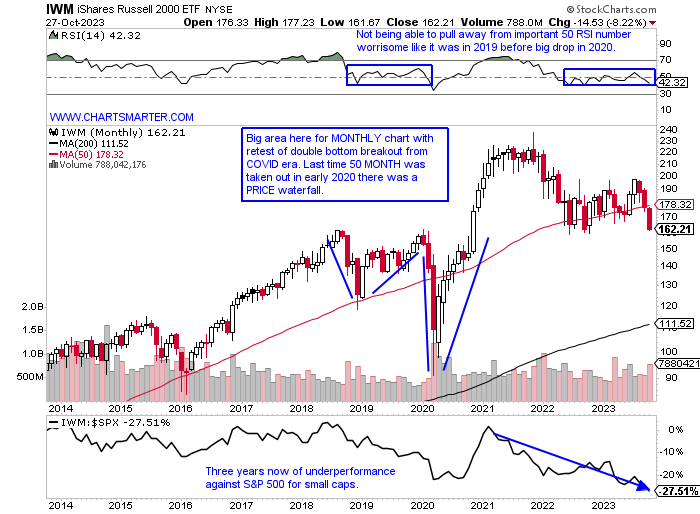
- The above quote can be applied to how investors perceive markets. Remember the markets are always right and one should try to listen to what they are saying very closely, and not how they think they should respond. Below is the MONTHLY chart of the small caps, which many believe are good leading indicators and they have looked perilous all year. The IWM is lower by 7% YTD, trailing well below the Nasdaq and S&P 500 which are higher by 17 and 7%, and the Dow down by 2% in 2023 thus far respectively. It is 2 days premature to look at the MONTHLY chart but its pierce underneath the 50 MONTH SMA in October looks definitive and notice the last time that occurred in early 2020 PRICE collapsed. I am not saying there is another COVID situation around the corner, but technicals are technicals and they speak. It was glued to the secular moving average since last May and its inability to thrust off of it in hindsight was telling. Perhaps we can see a crescendo of selling into year-end for some capitulation and a possible bottom but this looks like a do-not-touch for the time being. Its daily chart has not responded to two doji candles this past week another sign of worry.
Gold Changing Its Tune:
- For all the chatter as to how Gold has not lived up to its reputation as a beacon of stability in tough times over the last couple of years perhaps it is ready to. To me, I have never been a gold bug, and will never be a bug of anything for that matter because technicians must be able to adapt, but the precious metal is attractive in my opinion. Below is the daily chart and one has to be impressed with the way it is holding up around the very round 2000 number. Sure 3 of the last 6 sessions were above the figure, but none were able to CLOSE above it, but it is hardly losing altitude there either. The WEEKLY timeframe was above the 2011 double bottom pivot intraweek, but it too was unable to CLOSE above it, but give it credit for eking out a small gain after the prior 2 weeks recorded robust advances. The MONTHLY look has a bullish tint to it as well, but it has to break above 2100, an area of prior resistance in August 2020, March 2022 and May of this year. A breakout would carry a measured move to the very round 3000 number. Keep in mind that is in a pattern 5 years long so it would take some time. If it can CLOSE above 1980 on Tuesday that would mark a third bullish MONTHLY engulfing candle since last November, all with very impressive gains.

Chill in the Air?
- With expectations of a cold winter, Natural Gas rose every day last week before recording a bearish shooting star candle Friday (that streak ended an 8 session losing streak living up to its Widowmaker moniker). The rebound began with a successful retest of the bull flag breakout, which also firmed up right at its rising 50-day SMA. The WEEKLY chart below looks poised to potentially reach its measured move to the "round" 4 number after a break above the 3 level in a bullish ascending triangle breakout. This commodity is known for wild fluctuations and notice how the very round 10 number was the area of a bearish WEEKLY shooting star candle from late August 2022. Interestingly if we take a look at the longer-term MONTHLY chart, the 4 area for the measured move is the location of the 200 MONTH SMA which over the last decade has been a reliable source of resistance. The only exception was when it busted through in September 2021 and subsequently went on to hit double digits briefly (it did record a bear trap in December before its ultimate surge to 10). If it can touch $4 into year-end it could be a chilly holiday season for bears.

Luxury Weakness Suggesting Something Ominous?
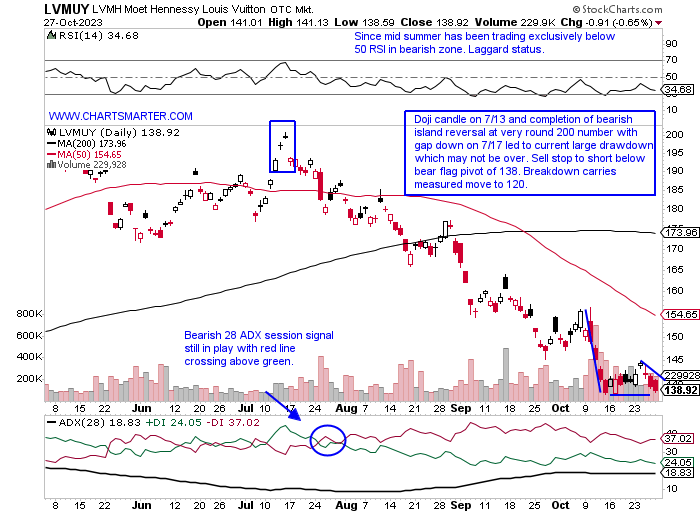
- European weakness in the luxury space has been pervasive. It has had mixed bifurcation with our domestic names as LULU which filled in a gap from the 10/13 session, which is also a double-bottom breakout right at its rising 50-day SMA. But TPR, which has declined 11 of the last 13 weeks, is now 42% off its most recent 52-week highs and has continued falling after announcing it was acquiring CPRI and dropped 16% on 8/10. ZGN has sliced off a third of its value during a 9 of 11-week losing streak. We know that softness has occurred with the lower-end consumers seen in DLTR and TGT, give credit to WMT and OLLI, and does slumping of luxury mean that the wealthy are feeling the pinch? The 800lb gorilla in the group with the chart below of LVMUY suggests this could be the case. It is teetering on the brink of another bear flag breakdown. Comparing luxury names around the globe shows the same thing, although since January ONON has been holding up with LULU best. Notice how the 21-day SMA has been influential with a nice move after climbing above in June-July, then a persistent downtrend since breaking below in August. Watch for a CLOSE above as it may be bottoming here after a bullish engulfing and morning star in early and mid-October.
Stick With Services:
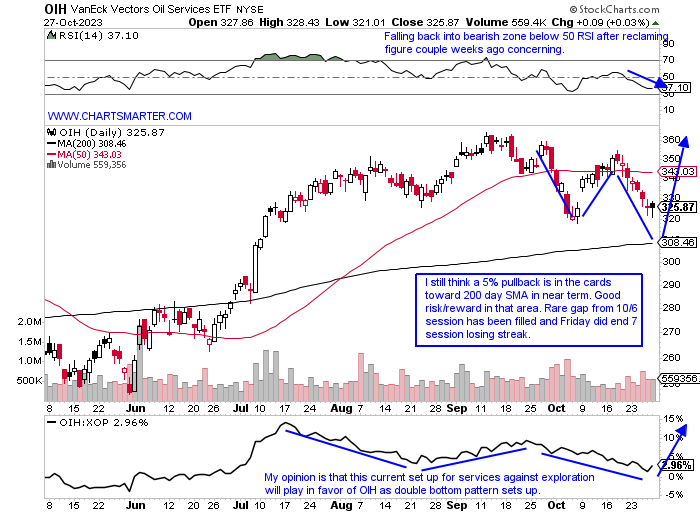
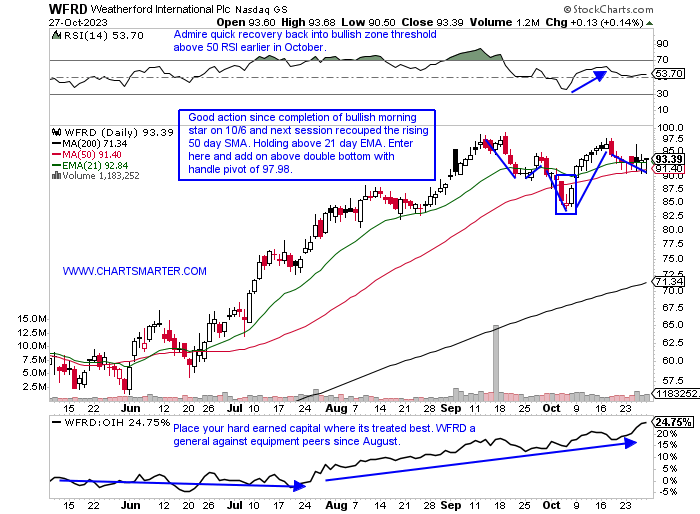
- Over time the creme rises to the top. If we were to test that theory in the energy space on would reward the services group as the OIH has advanced 11% as the XOP, via the production names, has dropped 4%. The XOP has dominated the headlines with the takeovers of PXD by Exxon and this past week with another blockbuster as CVX is buying HES. The premiums were somewhat miniscule, and HES crumbled 12% last week. As all this takes place the equipment players just minded their business and this group is not subject to the onerous regulation that the exploration names endure. Stocks I like in the arena are PUMP, which is currently above both its 50 and 200-day SMAs and is holding the very round 10 number well, but REPORTS Wednesday. OII recorded a bullish engulfing candle Friday after a poor earnings reaction on Thursday. A potential double bottom could be setting up. The big names like HAL which we profiled recently, but never CLOSED above the 43 pivot in an ascending triangle. Below we take a look at WFRD and the transportation play in STNG, both leaders in their respective groups.
Weatherford International:
- Equipment leader up 83 YTD and 134% over last one year period.
- Name 6% off most recent 52-week highs and good relative strength last week up fractionally as OIH fell more than 4%. The WEEKLY chart has look of bull flag aligning with very round par number. Breakout carries measured move to 145.
- FOUR consecutive positive earnings reactions (seven straight t00) up .5, 3.8, 3.9 and 12.6% on 10/25, 7/26, 4/26 and 2/8.
- Enter after completion of Morning Star, recapture of 21-day EMA.
- Entry WFRD here. Stop 91.
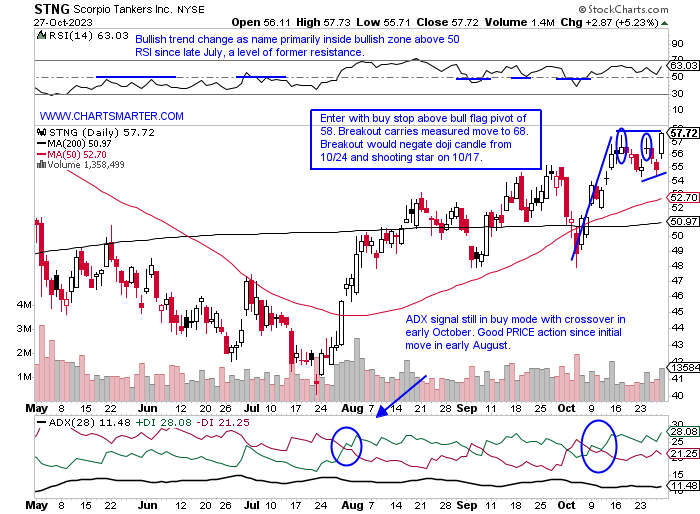
Scorpio Tankers:
- European oil transportation play up 7% YTD and 20% over last one year period. Dividend yield of 1.7%.
- Name 10% off most recent 52-week highs and up 11 of the last 14 weeks and good strength last week up better than 5%. The MONTHLY chart has look of cup with handle pattern in a base more than 8 years long.
- Earnings reactions mostly higher up 3.4, 3.6, and 7.6% on 8/2, 2/16, and 11/1/22, and fell 5.5% on 5/2.
- Enter with buy stop above bull flag.
- Entry STNG 58. Stop 55.
Good luck.
This article requires a Chartsmarter membership. Please click here to join.
"A man should look for what is, and not for what he thinks should be."- Albert Einstein
Size Matters:
- The above quote can be applied to how investors perceive markets. Remember the markets are always right and one should try to listen to what they are saying very closely, and not how they think they should respond. Below is the MONTHLY chart of the small caps, which many believe are good leading indicators and they have looked perilous all year. The IWM is lower by 7% YTD, trailing well below the Nasdaq and S&P 500 which are higher by 17 and 7%, and the Dow down by 2% in 2023 thus far respectively. It is 2 days premature to look at the MONTHLY chart but its pierce underneath the 50 MONTH SMA in October looks definitive and notice the last time that occurred in early 2020 PRICE collapsed. I am not saying there is another COVID situation around the corner, but technicals are technicals and they speak. It was glued to the secular moving average since last May and its inability to thrust off of it in hindsight was telling. Perhaps we can see a crescendo of selling into year-end for some capitulation and a possible bottom but this looks like a do-not-touch for the time being. Its daily chart has not responded to two doji candles this past week another sign of worry.
Gold Changing Its Tune:
- For all the chatter as to how Gold has not lived up to its reputation as a beacon of stability in tough times over the last couple of years perhaps it is ready to. To me, I have never been a gold bug, and will never be a bug of anything for that matter because technicians must be able to adapt, but the precious metal is attractive in my opinion. Below is the daily chart and one has to be impressed with the way it is holding up around the very round 2000 number. Sure 3 of the last 6 sessions were above the figure, but none were able to CLOSE above it, but it is hardly losing altitude there either. The WEEKLY timeframe was above the 2011 double bottom pivot intraweek, but it too was unable to CLOSE above it, but give it credit for eking out a small gain after the prior 2 weeks recorded robust advances. The MONTHLY look has a bullish tint to it as well, but it has to break above 2100, an area of prior resistance in August 2020, March 2022 and May of this year. A breakout would carry a measured move to the very round 3000 number. Keep in mind that is in a pattern 5 years long so it would take some time. If it can CLOSE above 1980 on Tuesday that would mark a third bullish MONTHLY engulfing candle since last November, all with very impressive gains.
Chill in the Air?
- With expectations of a cold winter, Natural Gas rose every day last week before recording a bearish shooting star candle Friday (that streak ended an 8 session losing streak living up to its Widowmaker moniker). The rebound began with a successful retest of the bull flag breakout, which also firmed up right at its rising 50-day SMA. The WEEKLY chart below looks poised to potentially reach its measured move to the "round" 4 number after a break above the 3 level in a bullish ascending triangle breakout. This commodity is known for wild fluctuations and notice how the very round 10 number was the area of a bearish WEEKLY shooting star candle from late August 2022. Interestingly if we take a look at the longer-term MONTHLY chart, the 4 area for the measured move is the location of the 200 MONTH SMA which over the last decade has been a reliable source of resistance. The only exception was when it busted through in September 2021 and subsequently went on to hit double digits briefly (it did record a bear trap in December before its ultimate surge to 10). If it can touch $4 into year-end it could be a chilly holiday season for bears.
Luxury Weakness Suggesting Something Ominous?
- European weakness in the luxury space has been pervasive. It has had mixed bifurcation with our domestic names as LULU which filled in a gap from the 10/13 session, which is also a double-bottom breakout right at its rising 50-day SMA. But TPR, which has declined 11 of the last 13 weeks, is now 42% off its most recent 52-week highs and has continued falling after announcing it was acquiring CPRI and dropped 16% on 8/10. ZGN has sliced off a third of its value during a 9 of 11-week losing streak. We know that softness has occurred with the lower-end consumers seen in DLTR and TGT, give credit to WMT and OLLI, and does slumping of luxury mean that the wealthy are feeling the pinch? The 800lb gorilla in the group with the chart below of LVMUY suggests this could be the case. It is teetering on the brink of another bear flag breakdown. Comparing luxury names around the globe shows the same thing, although since January ONON has been holding up with LULU best. Notice how the 21-day SMA has been influential with a nice move after climbing above in June-July, then a persistent downtrend since breaking below in August. Watch for a CLOSE above as it may be bottoming here after a bullish engulfing and morning star in early and mid-October.
Stick With Services:
- Over time the creme rises to the top. If we were to test that theory in the energy space on would reward the services group as the OIH has advanced 11% as the XOP, via the production names, has dropped 4%. The XOP has dominated the headlines with the takeovers of PXD by Exxon and this past week with another blockbuster as CVX is buying HES. The premiums were somewhat miniscule, and HES crumbled 12% last week. As all this takes place the equipment players just minded their business and this group is not subject to the onerous regulation that the exploration names endure. Stocks I like in the arena are PUMP, which is currently above both its 50 and 200-day SMAs and is holding the very round 10 number well, but REPORTS Wednesday. OII recorded a bullish engulfing candle Friday after a poor earnings reaction on Thursday. A potential double bottom could be setting up. The big names like HAL which we profiled recently, but never CLOSED above the 43 pivot in an ascending triangle. Below we take a look at WFRD and the transportation play in STNG, both leaders in their respective groups.
Weatherford International:
- Equipment leader up 83 YTD and 134% over last one year period.
- Name 6% off most recent 52-week highs and good relative strength last week up fractionally as OIH fell more than 4%. The WEEKLY chart has look of bull flag aligning with very round par number. Breakout carries measured move to 145.
- FOUR consecutive positive earnings reactions (seven straight t00) up .5, 3.8, 3.9 and 12.6% on 10/25, 7/26, 4/26 and 2/8.
- Enter after completion of Morning Star, recapture of 21-day EMA.
- Entry WFRD here. Stop 91.
Scorpio Tankers:
- European oil transportation play up 7% YTD and 20% over last one year period. Dividend yield of 1.7%.
- Name 10% off most recent 52-week highs and up 11 of the last 14 weeks and good strength last week up better than 5%. The MONTHLY chart has look of cup with handle pattern in a base more than 8 years long.
- Earnings reactions mostly higher up 3.4, 3.6, and 7.6% on 8/2, 2/16, and 11/1/22, and fell 5.5% on 5/2.
- Enter with buy stop above bull flag.
- Entry STNG 58. Stop 55.
Good luck.