Market Needs Apple:
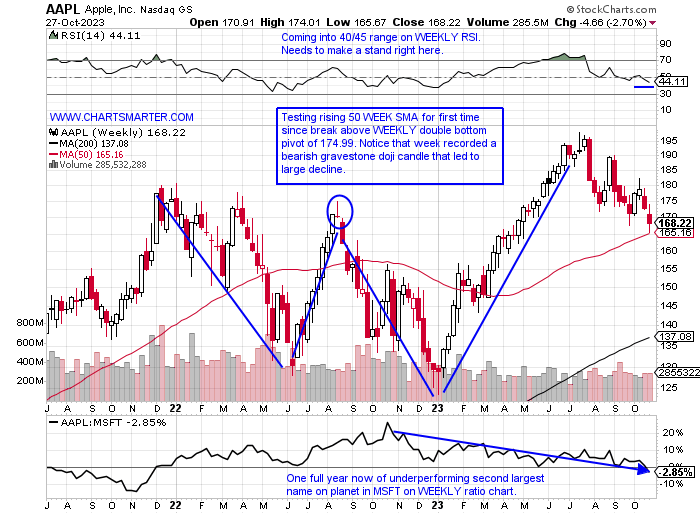
- Many market participants are shouting loudly that NVDA holds the key to the market whether it is able to hold the key round 400 number in a bearish head and shoulders neckline we spoke about earlier this week. But AAPL is still the largest company on the planet and holds sway. One may say, and I totally agree with this, that Apple has not really displayed much innovation in years, while NVDA certainly has. That being said like NVDA, AAPL is at a key technical level here as on the WEEKLY chart below it is testing the rising 50 WEEK SMA for the first time after a breakout, often a good initial entry in a strategy that was developed by William O'Neill. Volume trends are bearish as the stock has not recorded an accumulation week in 7 months and on its daily chart, it did just crack the 200-day SMA. There are plenty of technical stops placed around that secular line so let's see how it reacts in the coming weeks. If it can keep in the vicinity of the line that would be bullish, but the longer it swims below the less sanguine the message is.
European Looker:
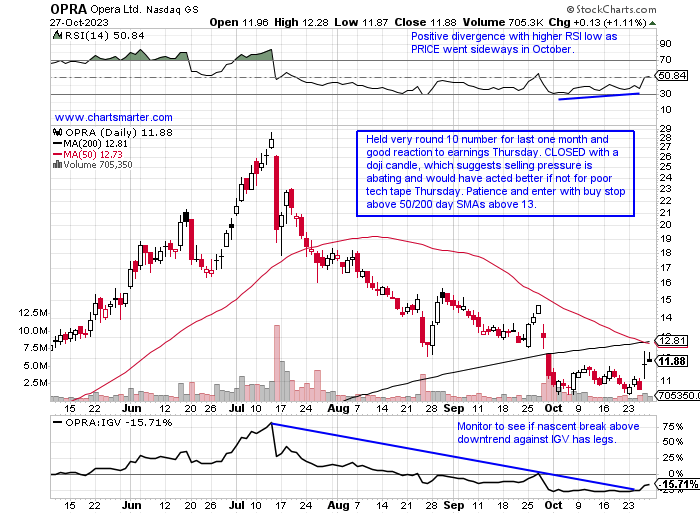
- The overall region which was a strong performer against our domestic benchmarks in late 2022-early 2023 has since tapered off. Some individual names in the area look attractive. To me, the chart below of the Norweigan software play OPRA deserves your attention. Patience is required but a move above 13 I think would be a good opportunity on the long side. This traded with a 3 handle, not a typo, last October and traveled almost to the very round 30 figure this summer. Since a wild WEEKLY bearish engulfing candle the week ending 7/14 that slumped almost 20% in the largest WEEKLY volume in at least 5 years, it has been in a persistent downtrend. In fact, prior to last week, it declined in 12 of the previous 15 weeks. Last week scored a bullish WEEKLY engulfing candle rising 13% and reclaiming its 50 WEEK SMA. Let this name prove it to you and enter with a buy stop and CLOSE above 13.
Recent Examples:
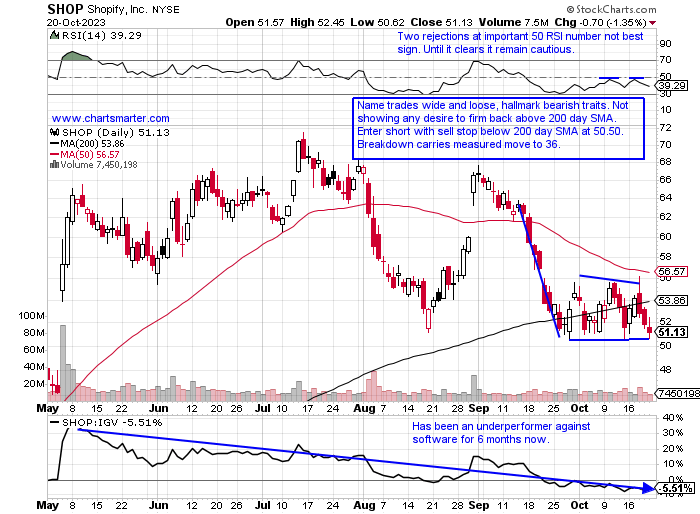
- There were a few software names that were spared this week. Nearly all of the large-cap plays in the space fell on the week with some by double digits including BILL and OKTA. TTD was close to falling more than 10% too. Below is the chart of Canadian play SHOP and how it appeared in our 10/23 Technology Note. This past week SHOP gave up the very round 50 number which has been influential dating back to the spring of 2022. That level acted as resistance earlier in 2023 and was support in August and then again recently until this week's piercing. This week recorded its first 4-week losing streak in 14 months and the loss of 9% leaves the name now 35% from its most recent 52-week highs. It still has a way to go before it meets its measured move to 36, of course, that may never happen, but undercutting its 50 WEEK SMA suggests selling pressure may start ramping up.
Special Situations:
Micron:
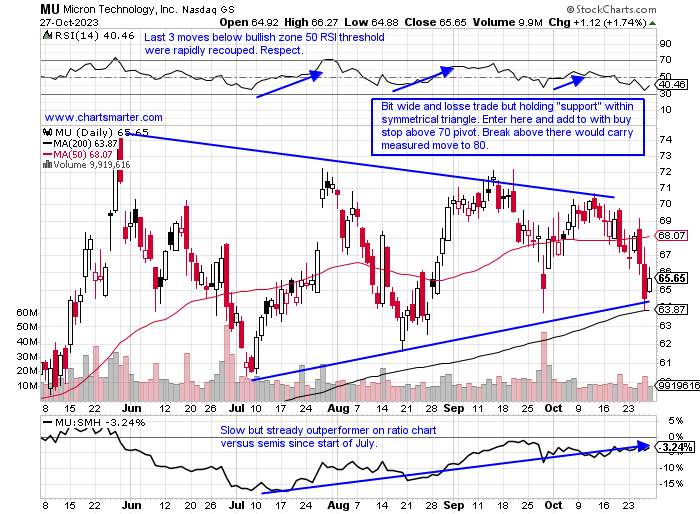
- "Old tech" semi play up 31% YTD and 26% over last one year period. Dividend yield of .7%.
- Name "just" 12% off most recent 52-week highs despite being lower 15 of the last 22 weeks. If recent lows hold this could be interpreted as a WEEKLY cup with handle in a pattern nearly 2 years long.
- Earnings reactions mostly lower off 4.4, 4.1, and 3.4% on 9/28, 6/29, and 12/22/22 and rose 7.2% on 3/29.
- Enter off support in symmetrical triangle.
- Entry MU here. Stop 63.
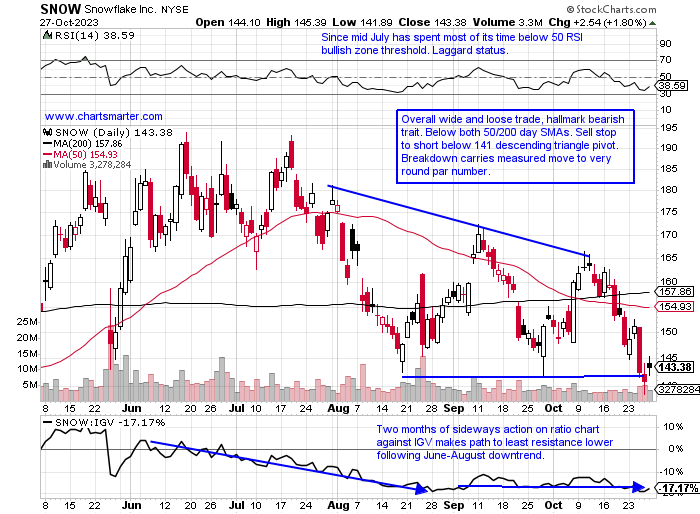
Snowflake:
- Software play UNCH YTD and lower by 15% over last one year period.
- Name 26% off most recent 52 week highs and WEEKLY chart has possible look of breaking below symmetrical triangle. Last 16 months have simply consolidated big move lower from very round 400 number in late 2021 to almost par in June 2022.
- Earnings reactions mostly lower off 5.2, 16.5, and 12.4% on 8/24, 5/25, and 3/2 after a gain of 7.8% on 12/1/22.
- Enter short with sell stop below bearish descending triangle.
- Entry SNOW 141. Buy stop 148.
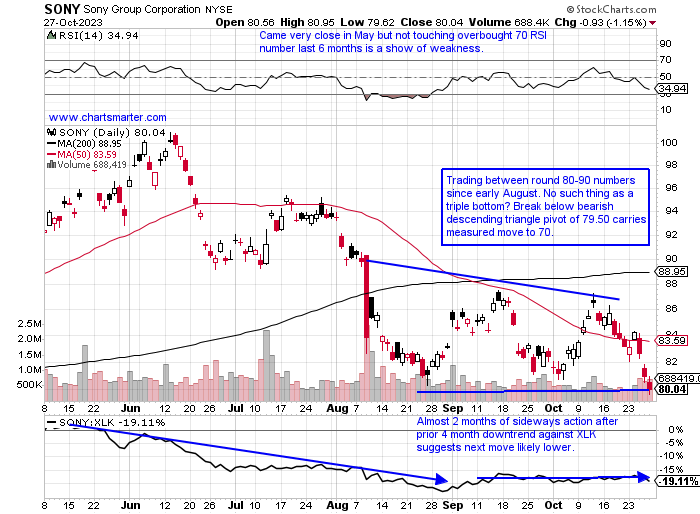
Sony Group Corporation:
- Japanese electronic equipment play up 5% YTD and 20% over last one year period. Dividend yield of .7%.
- Name 21% off most recent 52-week highs and on the WEEKLY chart same 79.50 has the look of a bear flag that began at the very round par number in mid-June. Break below that carries measured move to 60.
- Earnings reactions mixed up 4.7 and 9.7% on 2/2 and 11/1/22 and fell 6.6 and 5.7% on 8/9 and 4/28.
- Enter short with sell stop below bearish descending triangle.
- Entry SONY 79.50. Buy stop 83 (REPORTS 11/9 after close).
Good luck.
Entry summaries:
Buy after support in symmetrical triangle MU here. Stop 63.
Short with sell stop below bearish descending triangle SNOW 141. Buy stop 148.
Short with sell stop below bearish descending triangle SONY 79.50. Buy stop 83.
This article requires a Chartsmarter membership. Please click here to join.
Market Needs Apple:
- Many market participants are shouting loudly that NVDA holds the key to the market whether it is able to hold the key round 400 number in a bearish head and shoulders neckline we spoke about earlier this week. But AAPL is still the largest company on the planet and holds sway. One may say, and I totally agree with this, that Apple has not really displayed much innovation in years, while NVDA certainly has. That being said like NVDA, AAPL is at a key technical level here as on the WEEKLY chart below it is testing the rising 50 WEEK SMA for the first time after a breakout, often a good initial entry in a strategy that was developed by William O'Neill. Volume trends are bearish as the stock has not recorded an accumulation week in 7 months and on its daily chart, it did just crack the 200-day SMA. There are plenty of technical stops placed around that secular line so let's see how it reacts in the coming weeks. If it can keep in the vicinity of the line that would be bullish, but the longer it swims below the less sanguine the message is.
European Looker:
- The overall region which was a strong performer against our domestic benchmarks in late 2022-early 2023 has since tapered off. Some individual names in the area look attractive. To me, the chart below of the Norweigan software play OPRA deserves your attention. Patience is required but a move above 13 I think would be a good opportunity on the long side. This traded with a 3 handle, not a typo, last October and traveled almost to the very round 30 figure this summer. Since a wild WEEKLY bearish engulfing candle the week ending 7/14 that slumped almost 20% in the largest WEEKLY volume in at least 5 years, it has been in a persistent downtrend. In fact, prior to last week, it declined in 12 of the previous 15 weeks. Last week scored a bullish WEEKLY engulfing candle rising 13% and reclaiming its 50 WEEK SMA. Let this name prove it to you and enter with a buy stop and CLOSE above 13.
Recent Examples:
- There were a few software names that were spared this week. Nearly all of the large-cap plays in the space fell on the week with some by double digits including BILL and OKTA. TTD was close to falling more than 10% too. Below is the chart of Canadian play SHOP and how it appeared in our 10/23 Technology Note. This past week SHOP gave up the very round 50 number which has been influential dating back to the spring of 2022. That level acted as resistance earlier in 2023 and was support in August and then again recently until this week's piercing. This week recorded its first 4-week losing streak in 14 months and the loss of 9% leaves the name now 35% from its most recent 52-week highs. It still has a way to go before it meets its measured move to 36, of course, that may never happen, but undercutting its 50 WEEK SMA suggests selling pressure may start ramping up.
Special Situations:
Micron:
- "Old tech" semi play up 31% YTD and 26% over last one year period. Dividend yield of .7%.
- Name "just" 12% off most recent 52-week highs despite being lower 15 of the last 22 weeks. If recent lows hold this could be interpreted as a WEEKLY cup with handle in a pattern nearly 2 years long.
- Earnings reactions mostly lower off 4.4, 4.1, and 3.4% on 9/28, 6/29, and 12/22/22 and rose 7.2% on 3/29.
- Enter off support in symmetrical triangle.
- Entry MU here. Stop 63.
Snowflake:
- Software play UNCH YTD and lower by 15% over last one year period.
- Name 26% off most recent 52 week highs and WEEKLY chart has possible look of breaking below symmetrical triangle. Last 16 months have simply consolidated big move lower from very round 400 number in late 2021 to almost par in June 2022.
- Earnings reactions mostly lower off 5.2, 16.5, and 12.4% on 8/24, 5/25, and 3/2 after a gain of 7.8% on 12/1/22.
- Enter short with sell stop below bearish descending triangle.
- Entry SNOW 141. Buy stop 148.
Sony Group Corporation:
- Japanese electronic equipment play up 5% YTD and 20% over last one year period. Dividend yield of .7%.
- Name 21% off most recent 52-week highs and on the WEEKLY chart same 79.50 has the look of a bear flag that began at the very round par number in mid-June. Break below that carries measured move to 60.
- Earnings reactions mixed up 4.7 and 9.7% on 2/2 and 11/1/22 and fell 6.6 and 5.7% on 8/9 and 4/28.
- Enter short with sell stop below bearish descending triangle.
- Entry SONY 79.50. Buy stop 83 (REPORTS 11/9 after close).
Good luck.
Entry summaries:
Buy after support in symmetrical triangle MU here. Stop 63.
Short with sell stop below bearish descending triangle SNOW 141. Buy stop 148.
Short with sell stop below bearish descending triangle SONY 79.50. Buy stop 83.