"Enjoy when you can, and endure when you must." - Goethe
Familiar Territory:
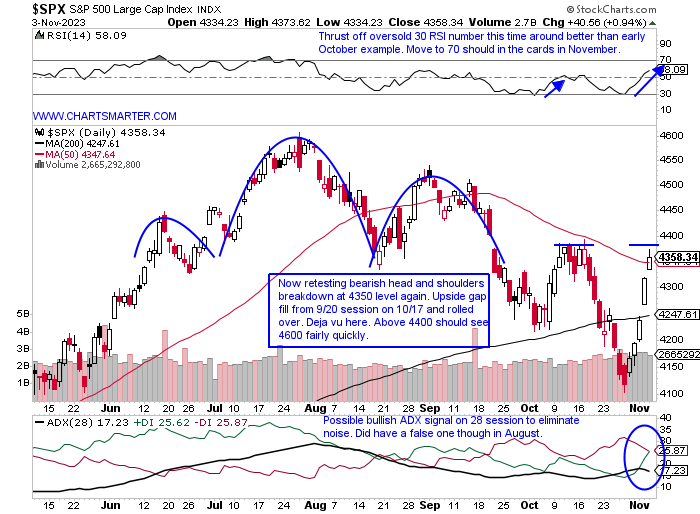
- The S&P 500 is in a recognizable area, back where it was rejected for 6 sessions in mid-October near the very round 4400 number. My feeling is that an instrument is a bit more confident the second time around testing a level. If it could break through that would signal a couple of confidence factors. First off it would break the series of lower highs that started with the bearish engulfing candle on 7/27 at the round 4600 number. Secondly, it would finally negate the bearish head and shoulders breakdown in late September (we spoke of the measured move to the 4100 level a couple of weeks back). Look for some stability above the 50-day SMA next week which then could start a possible double bottom base. The brute buying force in my opinion was best seen in the futures shrugging off the AAPL debacle Friday Morning. Another affirmative signal came from the quick recapture of the 200-day SMA late last week. Is this going to work out the same as when the benchmark CLOSED below the secular line for the same 5-6 sessions in early March before regaining its composure and resuming its powerful uptrend into the end of August?
Yield Apprehension:
- All eyes were on interest rates last week which have witnessed a strong move lower since a rejection at the very "round" 5 number on the 10-year (we spoke about a possible move to 5 this summer when many laughed at us). Below is the WEEKLY chart which shows the completion of the bearish evening star pattern last week. It remains to be seen if there will be follow-through lower, but chances are good. The daily chart shows a break BELOW a bull flag, and we know from FALSE moves come fast ones in the opposite direction. Additionally, the gap lower on Thursday finished a bearish island reversal after the gap up on 10/17. There were also a myriad of dubious candlesticks with the hanging man on 10/19, and engulfing candles on 10/26 and 11/1. More evidence that rates may have peaked was the action in real estate and homebuilders with the XLRE jumping 8.5% last week and the ITB flying by 13%. These are not normal moves obviously, and most likely are a combination of short covering and organic buying. Look for a retest of the double-bottom breakout from this summer.

Crude Awakening:
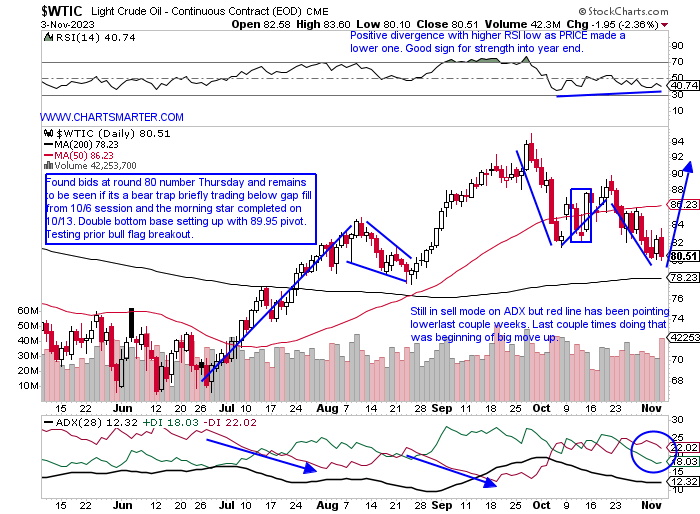
- Many headlines crossed the wires this past week with oil now below where it was when the mid-East conflict began. In my opinion, the selloff in crude is just consolidating a pretty firm move from the mid-60s in late Q2 to the mid-90s in late September. Crude did record a bearish engulfing candle Friday and fell 4 of the last 5 sessions, and has dropped 16% from highs made on 9/28 when it recorded a bearish dark cloud cover candle. Oil did continue its selloff in the face of a GDP number of nearly 5% reported last week, but is crude weakness speaking to soft economic growth? (GDP often is revised). The WEEKLY chart will show the bigger picture and it displays crude finding support here near the round 80 number, a level of former resistance that could very well turn into support (I think that drawdown since the WEEKLY doji candle in late September has run its course). My feeling is that one should retain a bullish stance with the added cushion of the rising 200-day SMA, which started curling higher just more than 2 months ago.
Beauty Is In the Eye of the Beholder:
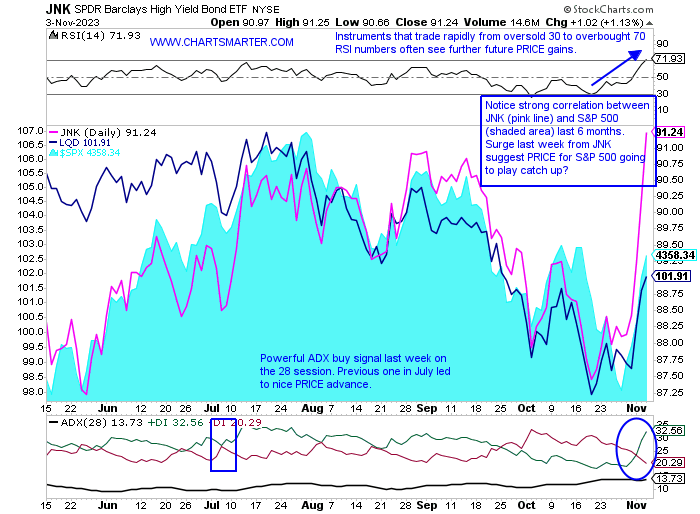
- One man's trash is another one's treasure the saying goes. In the stock market last week junk was someone's prized possession. The JNK was up 3% last week, its best WEEKLY gain of 2023, and on its WEEKLY chart it trusted back above a bullish ascending triangle. What was important there was the bear trap after moving above the very round 90 pivot the last week of August. The daily chart below shows the uncanny correlation between the JNK and S&P 500 trading almost in lockstep since late May. Does the surge in the pink line suggest that the S&P 500 is going to follow suit? The move back above the very round 90 number is a good sign for "risk on" and remember the vast majority of instruments that trade above it often trade to par and beyond. Big WEEKLY moves in the JNK however do not mean future gains, in fact, the best WEEKLY gain prior to last week came the week ending 5/27/22 rose almost 5%, and then immediately recorded a 3-week losing streak that slumped by a combined 10%. My feeling is that this will grind higher into year-end. Use a CLOSING stop below 89.
Utility Appeal:
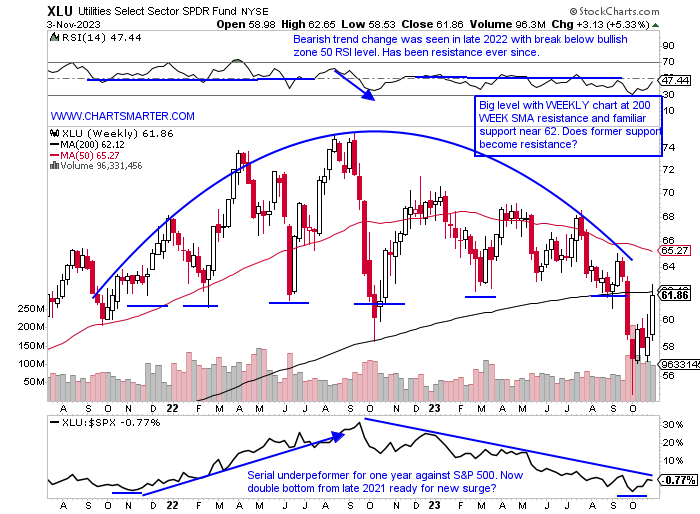
- Bond proxy groups like utilities and real estate should see continued bids if the 10-year continues to back off. Over the last one month period the XLU and XLRE are the best performing major S&P sectors. Of course, the vast majority of that move came last week. Were the utilities sniffing out weakness coming in the ten-year as the XLU bottomed in early October with some bullish candlesticks? The beauty of technical analysis as it often makes its presence felt before the fundamentals. The daily chart shows a bullish piercing line and an engulfing candle on 10/3 and 10/6 respectively. The ten-year was very close to the "round" 5-figure at that point. One can see the 10-year and the XLU are mean reverting in PRICE, and one must respect that the XLU was the only major S&P sector ETF not to record a lower low in October with the exception of the XLP. Below is the WEEKLY chart showing the XLU at a level that has plenty of PRICE memory. Let us take a look at 2 standouts in the group below.
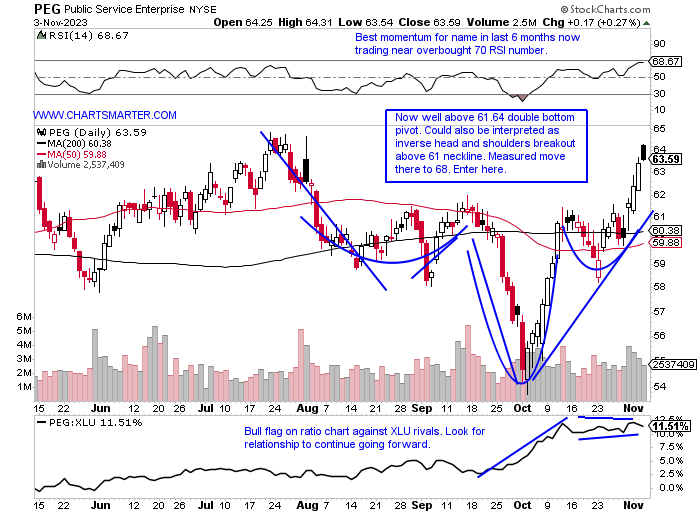
Public Service Enterprise:
- Utility play up 4% YTD and 11% over last one-year period (has nuclear component). Dividend yield of 3.6%.
- Name 3% off most recent 52-week highs and rose almost 6% last week. WEEK ending 10/13 completed bullish morning star pattern and WEEKLY chart has the look of wanting to move toward round 70 number into year-end.
- Earnings reactions mixed up 2.5 and .1% on 10/31 and 8/1 and fell .5 and 1.7% on 5/2 and 2/21.
- Enter after recent double bottom breakout.
- Enter PEG here. Stop 61.
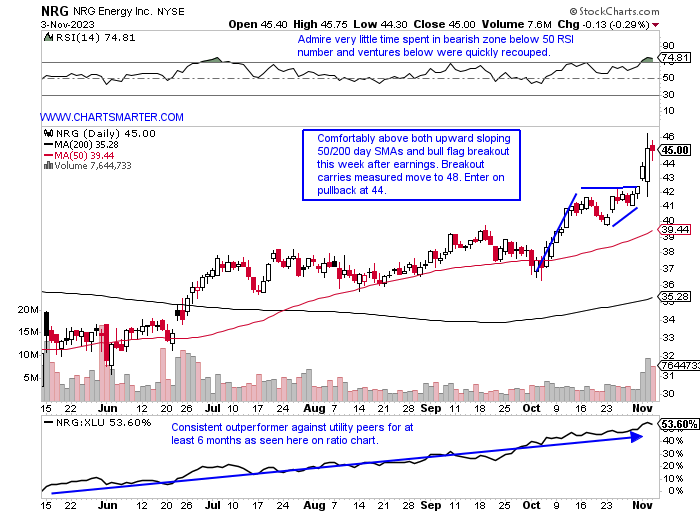
NRG Energy:
- Utility play up 41 % YTD and 3% over last one-year period. Dividend yield of 3.4%.
- Name 3% off most recent 52-week highs and has advanced 4 of the last 5 weeks with all 4 gainers CLOSING at or near top of WEEKLY range. Good relative strength last week up 8% on best WEEKLY volume in 3 months breaking above double bottom base.
- Earnings reactions mostly lower off 2, 6.2, and 4.9% on 8/8, 5/4, and 2/16 before recent gain of 2.9% on 11/2.
- Enter on pullback into bull flag breakout.
- Enter NRG 44. Stop 41.50.
Good luck.
This article requires a Chartsmarter membership. Please click here to join.
"Enjoy when you can, and endure when you must." - Goethe
Familiar Territory:
- The S&P 500 is in a recognizable area, back where it was rejected for 6 sessions in mid-October near the very round 4400 number. My feeling is that an instrument is a bit more confident the second time around testing a level. If it could break through that would signal a couple of confidence factors. First off it would break the series of lower highs that started with the bearish engulfing candle on 7/27 at the round 4600 number. Secondly, it would finally negate the bearish head and shoulders breakdown in late September (we spoke of the measured move to the 4100 level a couple of weeks back). Look for some stability above the 50-day SMA next week which then could start a possible double bottom base. The brute buying force in my opinion was best seen in the futures shrugging off the AAPL debacle Friday Morning. Another affirmative signal came from the quick recapture of the 200-day SMA late last week. Is this going to work out the same as when the benchmark CLOSED below the secular line for the same 5-6 sessions in early March before regaining its composure and resuming its powerful uptrend into the end of August?
Yield Apprehension:
- All eyes were on interest rates last week which have witnessed a strong move lower since a rejection at the very "round" 5 number on the 10-year (we spoke about a possible move to 5 this summer when many laughed at us). Below is the WEEKLY chart which shows the completion of the bearish evening star pattern last week. It remains to be seen if there will be follow-through lower, but chances are good. The daily chart shows a break BELOW a bull flag, and we know from FALSE moves come fast ones in the opposite direction. Additionally, the gap lower on Thursday finished a bearish island reversal after the gap up on 10/17. There were also a myriad of dubious candlesticks with the hanging man on 10/19, and engulfing candles on 10/26 and 11/1. More evidence that rates may have peaked was the action in real estate and homebuilders with the XLRE jumping 8.5% last week and the ITB flying by 13%. These are not normal moves obviously, and most likely are a combination of short covering and organic buying. Look for a retest of the double-bottom breakout from this summer.
Crude Awakening:
- Many headlines crossed the wires this past week with oil now below where it was when the mid-East conflict began. In my opinion, the selloff in crude is just consolidating a pretty firm move from the mid-60s in late Q2 to the mid-90s in late September. Crude did record a bearish engulfing candle Friday and fell 4 of the last 5 sessions, and has dropped 16% from highs made on 9/28 when it recorded a bearish dark cloud cover candle. Oil did continue its selloff in the face of a GDP number of nearly 5% reported last week, but is crude weakness speaking to soft economic growth? (GDP often is revised). The WEEKLY chart will show the bigger picture and it displays crude finding support here near the round 80 number, a level of former resistance that could very well turn into support (I think that drawdown since the WEEKLY doji candle in late September has run its course). My feeling is that one should retain a bullish stance with the added cushion of the rising 200-day SMA, which started curling higher just more than 2 months ago.
Beauty Is In the Eye of the Beholder:
- One man's trash is another one's treasure the saying goes. In the stock market last week junk was someone's prized possession. The JNK was up 3% last week, its best WEEKLY gain of 2023, and on its WEEKLY chart it trusted back above a bullish ascending triangle. What was important there was the bear trap after moving above the very round 90 pivot the last week of August. The daily chart below shows the uncanny correlation between the JNK and S&P 500 trading almost in lockstep since late May. Does the surge in the pink line suggest that the S&P 500 is going to follow suit? The move back above the very round 90 number is a good sign for "risk on" and remember the vast majority of instruments that trade above it often trade to par and beyond. Big WEEKLY moves in the JNK however do not mean future gains, in fact, the best WEEKLY gain prior to last week came the week ending 5/27/22 rose almost 5%, and then immediately recorded a 3-week losing streak that slumped by a combined 10%. My feeling is that this will grind higher into year-end. Use a CLOSING stop below 89.
Utility Appeal:
- Bond proxy groups like utilities and real estate should see continued bids if the 10-year continues to back off. Over the last one month period the XLU and XLRE are the best performing major S&P sectors. Of course, the vast majority of that move came last week. Were the utilities sniffing out weakness coming in the ten-year as the XLU bottomed in early October with some bullish candlesticks? The beauty of technical analysis as it often makes its presence felt before the fundamentals. The daily chart shows a bullish piercing line and an engulfing candle on 10/3 and 10/6 respectively. The ten-year was very close to the "round" 5-figure at that point. One can see the 10-year and the XLU are mean reverting in PRICE, and one must respect that the XLU was the only major S&P sector ETF not to record a lower low in October with the exception of the XLP. Below is the WEEKLY chart showing the XLU at a level that has plenty of PRICE memory. Let us take a look at 2 standouts in the group below.
Public Service Enterprise:
- Utility play up 4% YTD and 11% over last one-year period (has nuclear component). Dividend yield of 3.6%.
- Name 3% off most recent 52-week highs and rose almost 6% last week. WEEK ending 10/13 completed bullish morning star pattern and WEEKLY chart has the look of wanting to move toward round 70 number into year-end.
- Earnings reactions mixed up 2.5 and .1% on 10/31 and 8/1 and fell .5 and 1.7% on 5/2 and 2/21.
- Enter after recent double bottom breakout.
- Enter PEG here. Stop 61.
NRG Energy:
- Utility play up 41 % YTD and 3% over last one-year period. Dividend yield of 3.4%.
- Name 3% off most recent 52-week highs and has advanced 4 of the last 5 weeks with all 4 gainers CLOSING at or near top of WEEKLY range. Good relative strength last week up 8% on best WEEKLY volume in 3 months breaking above double bottom base.
- Earnings reactions mostly lower off 2, 6.2, and 4.9% on 8/8, 5/4, and 2/16 before recent gain of 2.9% on 11/2.
- Enter on pullback into bull flag breakout.
- Enter NRG 44. Stop 41.50.
Good luck.