"You can also commit injustice by doing nothing." -Marcus Aurelius
Playing Defense:
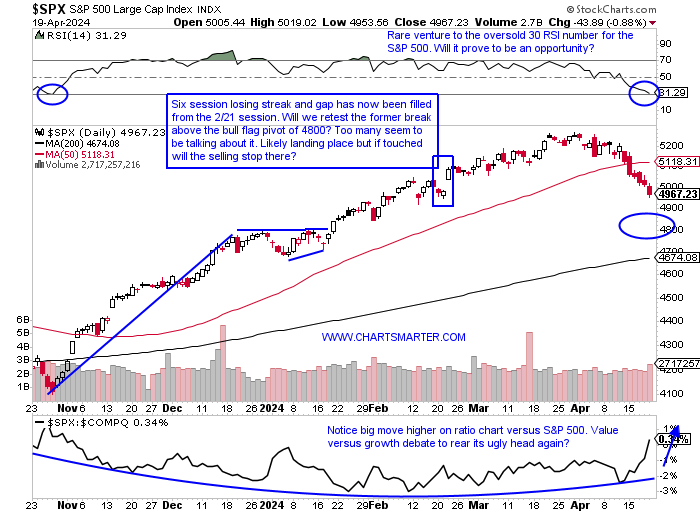
- The quote above certainly has a multitude of ways to discern it, but in a market sense, it can be viewed as holding onto losers longer than we should. The current environment we see ourselves in is a difficult one, and for that reason, one should remain small with a hefty cash position. Markets seemed to say last week that we have been wounded and the best thing would be for some well-deserved rest. The moves off the October lows have been substantial and we are in the process now of giving some of that back which is prudent. The S&P 500 is now on a 6-day losing streak with all 6 of those sessions CLOSING at or very near lows for the daily range, a bearish trait. Technology is now UNCH in 2024 if one can believe that and AAPL, the second-largest company in the world has been in a tailspin since the doji candle on 12/14/23. It fell every day last week, losing 6.5% its worst WEEKLY decline in exactly one year. MSFT the biggest stock on the planet is back to the very round 400 number, the fourth time it has done so since late January and my belief is the more times a line is touched the less likely it is to be supportive. Perhaps it will bounce near the very round 400 number and go on to form a bearish head and shoulders with a bounce toward the 420 level. Large levels of cash is a prudent position at the moment.
Greenback Skeptic Pain:
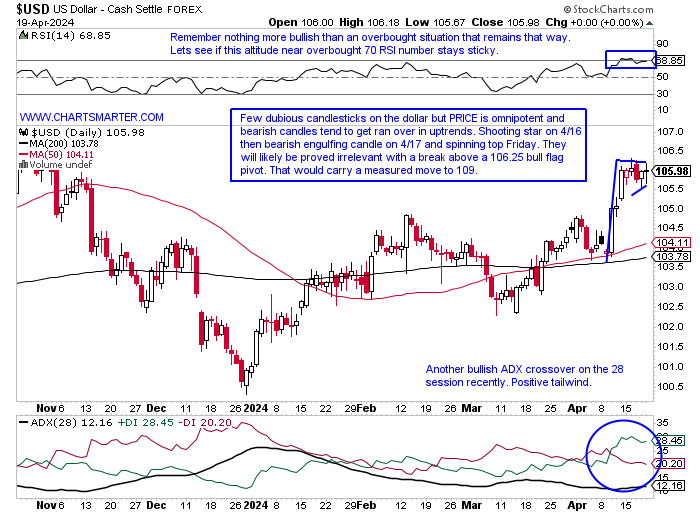
- The US Dollar can have many implications on different asset classes. Many have touted the demise of the greenback but the PRICE action currently suggests otherwise. In our 4/1 WEEK AHEAD Note we took a sanguine view and for the time being it has been proven correct. The chart we presented in that report admired the breakout above the bullish inverse head and shoulders formation that carries a measured move to 110. It aligns with the daily chart below with the present bull flag pattern. It is just refusing to give ground, and it is likely a combination of organic buying and short covering. The WEEKLY chart displays that the dollar could make its way toward 114 which would complete a cup base. Bears were unable to do any work to the downside with a very tight range, and although it did record a spinning top candle (which could indicate fatigue) it gave back very little from the prior week's robust advance. The chart here showing the path of the S&P 500 and the US Dollar shows they were both for the most part on an upward trajectory in 2024. We wondered which one would blink first and this week the S&P 500 showed its weak hand.
Silver Lining:
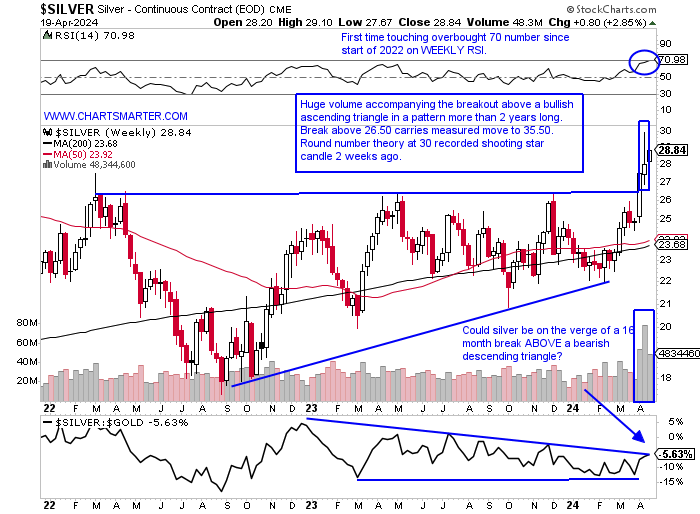
- Gold has been dominating headlines in 2024 and rightfully so. We have been pounding the table on the precious metal since the end of 2023 in our WEEK AHEAD Note when one had to come away impressed with how it broke above the MONTHLY bullish ascending triangle pivot of 2100, which carries a measured move to 2600. It is well on its way to meeting that forecast now above 2400, but perhaps now it makes sense to look at the WEEKLY chart of silver, showing its own strong break above an ascending triangle. Notice the metal had plenty of reason to back off in the mid-26 area, as PRICE was soundly rejected there in early 2022, and again in early and mid 2023. Not only did it fail to hesitate at the level, but it registered a beach ball held underwater breakout. Not surprisingly it witnessed pushback at the round 30 number, but I feel this could make its way toward 35.50 into the second half of 2024. It will be interesting to see how it reacts to this 30 level, as on the MONTHLY chart it weakened when it touched the area in late 2020 and early 2021.
Japan Line in the Sand:
- The Nikkei like many other benchmarks around the world, is in a precarious situation. It sits on the precipice of a potential breakdown lower from a bearish rounded top pattern and a break under 37000 would carry a measured move to 33000 (here that shows would be a pullback into the WEEKLY double bottom with handle breakout). The MONTHLY chart shows a bearish engulfing candle in the making with 7 sessions left in April and if it holds could spur some additional selling). However, if it can stabilize in this area with the retest of the bull flag it could restart its uptrend. Only PRICE knows and no one has to be a hero here. Once one of the prior two scenarios unfold then one can develop conviction. In the meantime look for better opportunities within the region. TAK is a name that offers good risk/reward down here following the completion of a bullish harami cross (doji completed the pattern on 4/18 and they are adept at signaling potential changes in the prevailing trend). It has lagged the overall healthcare space down 23% from its most recent 52-week highs, so keep it on a tight leash and use a CLOSING stop below 12.75. That softness has produced an attractive dividend yield of more than 7%.

Energy Well Rested:
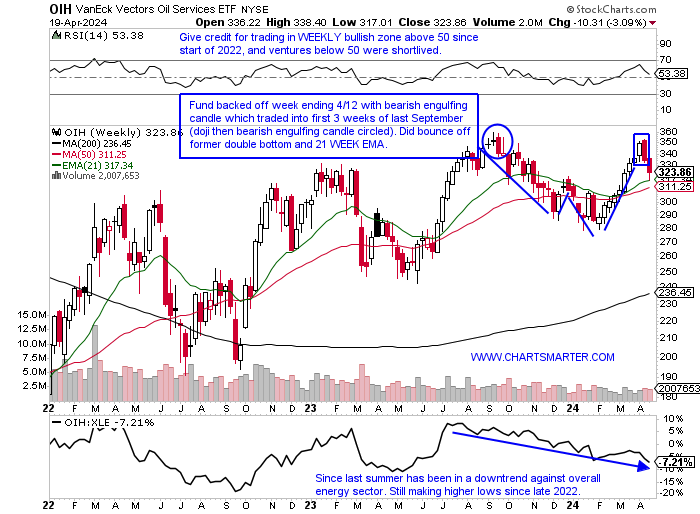
- I have been very vocal in my belief that energy will likely continue to be the best-performing major S&P sector by the end of 2024. The chart I have shown in the past demonstrates that it has been feast or famine for the group for the last ten years being either right at the top, or bottom, of the sector rankings (in 2017 and 2023 it was the 10th best of the 11 major S&P sectors). This year, of course, is still very early but it sits right at the top again with the XLE up better than 14%. Looking at the WEEKLY chart of the OIH (equipment) below we can see the support last week at the rising 21 WEEK EMA, which also successfully retested a former double-bottom breakout pivot. Seasonality gives the second-best 3-month stretch, starting in May which sees an average combined return of 10% between May-July. The daily time frame looks good too with a 50% retracement from the strong move from early February to the recent peak and finding bids at both the 50 and 200 day SMAs. Like the XLE, the OIH is top-heavy and it was good to see the second-largest holding in HAL find support this week at its 200-day SMA and the break above a bullish inverse head and shoulders formation. Let us take a closer look at two leaders in the space in WFRD and SDRL too.
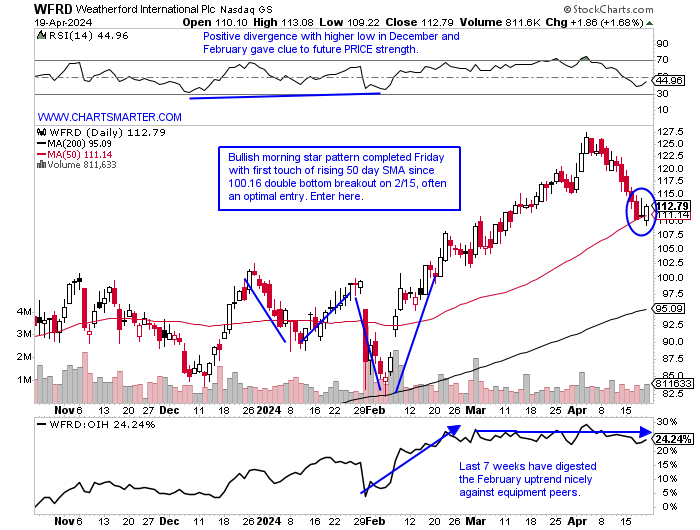
Weatherford:
- Equipment play up 15% YTD and 75% over last one year period.
- Name 12% off most recent 52-week highs and last week registered just second back-to-back WEEKLY losses of 2024. MONTHLY chart shows stock has not fallen in consecutive months since November-December 2021. Recent bull flag breakout just above par has measured move to 160.
- FOUR straight positive earnings reactions (8 consecutive) up 7.1, .5, 3.8, and 3.9% on 2/7, 10/25, 7/26 and 4/26/23.
- Enter on first touch of rising 50-day SMA following recent breakout.
- Entry WFRD here. Stop (REPORTS Wednesday after the close).
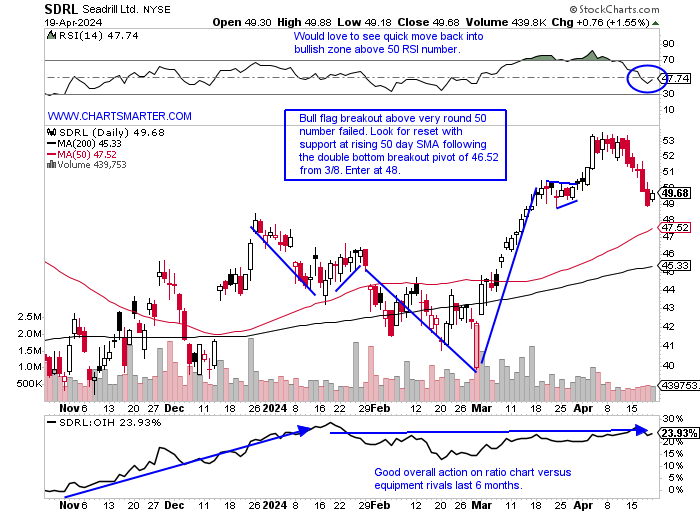
Seadrill:
- Equipment play up 5% YTD and 36% over last one year period.
- Name 7% off most recent 52-week highs and WEEKLY chart shows trade between round 40-50 numbers and break back into range I believe will turn out to be a bear trap. Notice strong accumulation during 7-week win streak weeks ending between 2/23-4/5.
- Earnings reactions mostly higher up 5.6, 2.4, and 1% on 11/28, 8/20, and 6/2/23 before a recent loss of .2% on 2/29.
- Enter on pullback into rising 50-day SMA following breakout.
- Entry SDRL 48. Stop 46.
This article requires a Chartsmarter membership. Please click here to join.
"You can also commit injustice by doing nothing." -Marcus Aurelius
Playing Defense:
- The quote above certainly has a multitude of ways to discern it, but in a market sense, it can be viewed as holding onto losers longer than we should. The current environment we see ourselves in is a difficult one, and for that reason, one should remain small with a hefty cash position. Markets seemed to say last week that we have been wounded and the best thing would be for some well-deserved rest. The moves off the October lows have been substantial and we are in the process now of giving some of that back which is prudent. The S&P 500 is now on a 6-day losing streak with all 6 of those sessions CLOSING at or very near lows for the daily range, a bearish trait. Technology is now UNCH in 2024 if one can believe that and AAPL, the second-largest company in the world has been in a tailspin since the doji candle on 12/14/23. It fell every day last week, losing 6.5% its worst WEEKLY decline in exactly one year. MSFT the biggest stock on the planet is back to the very round 400 number, the fourth time it has done so since late January and my belief is the more times a line is touched the less likely it is to be supportive. Perhaps it will bounce near the very round 400 number and go on to form a bearish head and shoulders with a bounce toward the 420 level. Large levels of cash is a prudent position at the moment.
Greenback Skeptic Pain:
- The US Dollar can have many implications on different asset classes. Many have touted the demise of the greenback but the PRICE action currently suggests otherwise. In our 4/1 WEEK AHEAD Note we took a sanguine view and for the time being it has been proven correct. The chart we presented in that report admired the breakout above the bullish inverse head and shoulders formation that carries a measured move to 110. It aligns with the daily chart below with the present bull flag pattern. It is just refusing to give ground, and it is likely a combination of organic buying and short covering. The WEEKLY chart displays that the dollar could make its way toward 114 which would complete a cup base. Bears were unable to do any work to the downside with a very tight range, and although it did record a spinning top candle (which could indicate fatigue) it gave back very little from the prior week's robust advance. The chart here showing the path of the S&P 500 and the US Dollar shows they were both for the most part on an upward trajectory in 2024. We wondered which one would blink first and this week the S&P 500 showed its weak hand.
Silver Lining:
- Gold has been dominating headlines in 2024 and rightfully so. We have been pounding the table on the precious metal since the end of 2023 in our WEEK AHEAD Note when one had to come away impressed with how it broke above the MONTHLY bullish ascending triangle pivot of 2100, which carries a measured move to 2600. It is well on its way to meeting that forecast now above 2400, but perhaps now it makes sense to look at the WEEKLY chart of silver, showing its own strong break above an ascending triangle. Notice the metal had plenty of reason to back off in the mid-26 area, as PRICE was soundly rejected there in early 2022, and again in early and mid 2023. Not only did it fail to hesitate at the level, but it registered a beach ball held underwater breakout. Not surprisingly it witnessed pushback at the round 30 number, but I feel this could make its way toward 35.50 into the second half of 2024. It will be interesting to see how it reacts to this 30 level, as on the MONTHLY chart it weakened when it touched the area in late 2020 and early 2021.
Japan Line in the Sand:
- The Nikkei like many other benchmarks around the world, is in a precarious situation. It sits on the precipice of a potential breakdown lower from a bearish rounded top pattern and a break under 37000 would carry a measured move to 33000 (here that shows would be a pullback into the WEEKLY double bottom with handle breakout). The MONTHLY chart shows a bearish engulfing candle in the making with 7 sessions left in April and if it holds could spur some additional selling). However, if it can stabilize in this area with the retest of the bull flag it could restart its uptrend. Only PRICE knows and no one has to be a hero here. Once one of the prior two scenarios unfold then one can develop conviction. In the meantime look for better opportunities within the region. TAK is a name that offers good risk/reward down here following the completion of a bullish harami cross (doji completed the pattern on 4/18 and they are adept at signaling potential changes in the prevailing trend). It has lagged the overall healthcare space down 23% from its most recent 52-week highs, so keep it on a tight leash and use a CLOSING stop below 12.75. That softness has produced an attractive dividend yield of more than 7%.
Energy Well Rested:
- I have been very vocal in my belief that energy will likely continue to be the best-performing major S&P sector by the end of 2024. The chart I have shown in the past demonstrates that it has been feast or famine for the group for the last ten years being either right at the top, or bottom, of the sector rankings (in 2017 and 2023 it was the 10th best of the 11 major S&P sectors). This year, of course, is still very early but it sits right at the top again with the XLE up better than 14%. Looking at the WEEKLY chart of the OIH (equipment) below we can see the support last week at the rising 21 WEEK EMA, which also successfully retested a former double-bottom breakout pivot. Seasonality gives the second-best 3-month stretch, starting in May which sees an average combined return of 10% between May-July. The daily time frame looks good too with a 50% retracement from the strong move from early February to the recent peak and finding bids at both the 50 and 200 day SMAs. Like the XLE, the OIH is top-heavy and it was good to see the second-largest holding in HAL find support this week at its 200-day SMA and the break above a bullish inverse head and shoulders formation. Let us take a closer look at two leaders in the space in WFRD and SDRL too.
Weatherford:
- Equipment play up 15% YTD and 75% over last one year period.
- Name 12% off most recent 52-week highs and last week registered just second back-to-back WEEKLY losses of 2024. MONTHLY chart shows stock has not fallen in consecutive months since November-December 2021. Recent bull flag breakout just above par has measured move to 160.
- FOUR straight positive earnings reactions (8 consecutive) up 7.1, .5, 3.8, and 3.9% on 2/7, 10/25, 7/26 and 4/26/23.
- Enter on first touch of rising 50-day SMA following recent breakout.
- Entry WFRD here. Stop (REPORTS Wednesday after the close).
Seadrill:
- Equipment play up 5% YTD and 36% over last one year period.
- Name 7% off most recent 52-week highs and WEEKLY chart shows trade between round 40-50 numbers and break back into range I believe will turn out to be a bear trap. Notice strong accumulation during 7-week win streak weeks ending between 2/23-4/5.
- Earnings reactions mostly higher up 5.6, 2.4, and 1% on 11/28, 8/20, and 6/2/23 before a recent loss of .2% on 2/29.
- Enter on pullback into rising 50-day SMA following breakout.
- Entry SDRL 48. Stop 46.