Turbulence Ahead?
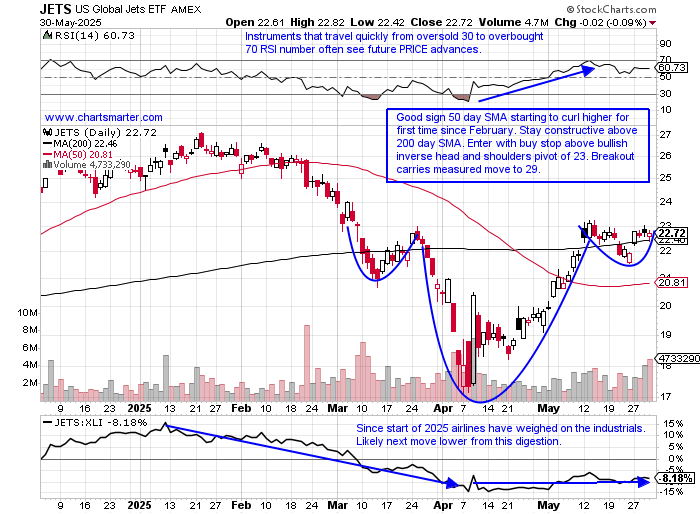
- The airline group inside the diversified industrial space is at a familiar altitude, pun intended. The daily chart below of the JETS shows it in a tight range between 21-23 the last 3 weeks, an area it traded within in early to late March. Interestingly this ETF did not bottom like the overall market did on 4/7, but on 4/9 flying more than 17% in well more than double the average daily volume. Looking at its MONTHLY chart May completed a bullish morning star pattern, after a hammer candle in April and notice the bearish evening star completed in August 2023 with the rare doji in July (three others occurred near the top of the last decade in February, July, and December 2019). Influential stocks in the group include LUV, and talking about how dojis are well known for projecting tops (or bottoms near lows) at highs did so on 3/24. It is just above a cup with handle trigger of 32.99, although it did record 3 straight dubious candles to end last week with a doji, shooting star, and a spinning top. Not a traditional airline, but an aviation disrupter in JOBY is worth a look. The single-digit name, not my cup of tea, could be taken advantage on the long side with a gap fill near 7 from the 5/27 session. Notice it was halted at the very round 10 number with just one CLOSE above on 1/7, but this could be headed back there sometime in the second half, especially after the confidence boost after the TM investment.
Nuclear Move:
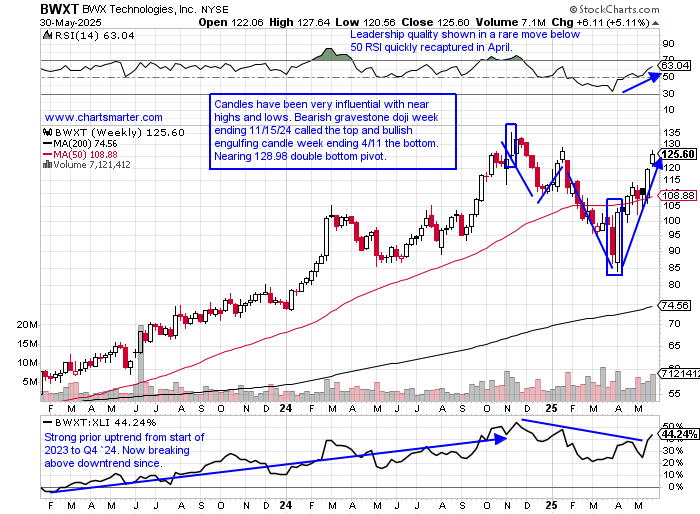
Unless one was hiding under a rock they would have missed the "nuclear" jump on 5/23 when the Trump administration signaled its affinity for the energy source. Individual names like OKLO which bulls will say is 3 days into forming a legitimate handle on a cup base with a potential pivot of 57.67 (bears will claim double top near round 60 number) stormed higher by more than 200% during its current 6 week winning streak. CCJ is still comfortably above a bull flag breakout pivot of 54 which carries a measured move to 69, but with the spinning top and doji candle on 5/28-29 may need some back and filling before resuming its uptrend. LTBR, a smaller speculative play, was subject to round number theory breaking above a 10.39 double bottom pivot before retesting the very round 10 number before jumping a rapid 70%. Below is the WEEKLY chart of BWXT, considered the "picks and shovels" play of the space and this is honing in on a double bottom breakout trigger. Its DAILY chart would be served best if it can consolidate the firm advance and form a bull flag. If that should occur look for a move to 150 later in the second half.
Recent Examples:
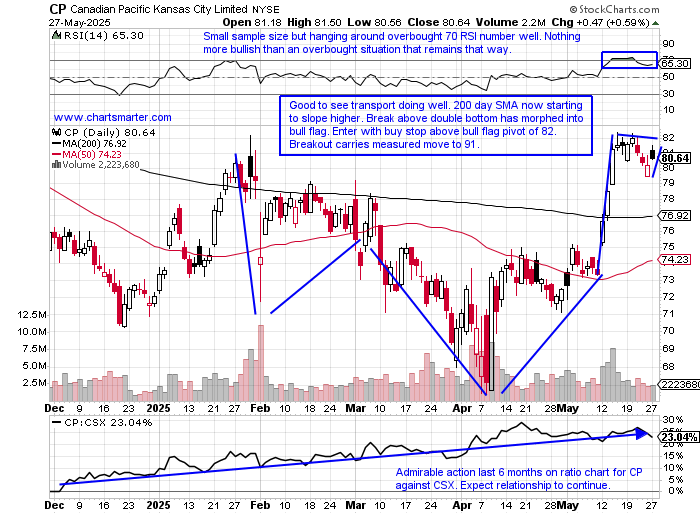
- For a long time, transport names have lagged. This is usually a sign of an unhealthy economy. Perhaps modes of transportation have changed with technology, but the emergence of some good charts in the railroad space is a welcome sign. There is some bifurcation among the small group but on the performance chart here on a YTD basis there is a clear winner and that is where one should look to deploy their hard-earned capital. That would be the daily chart of CP and how it appeared in our 5/28 Industrial Note. It has advanced 13% thus far in 2025 and although it has not broken above the suggested bull flag of 82 it is hovering right near it as of Friday's CLOSE. The stock is "just" 7% off its most recent 52-week highs, but all four rivals, CSX, NSC, UNP, and CNI, are between 11-18% off the annual peaks. Respect how it finished May right at highs for the month and it should now gravitate toward the add-on buy point above the double-bottom trigger of 86.65 into the end of Q2 beginning of Q3.
Special Situations:
Quanta Services:
- Engineering and construction leader up 8% YTD and 24% over last one year period. Dividend yield of .1%.
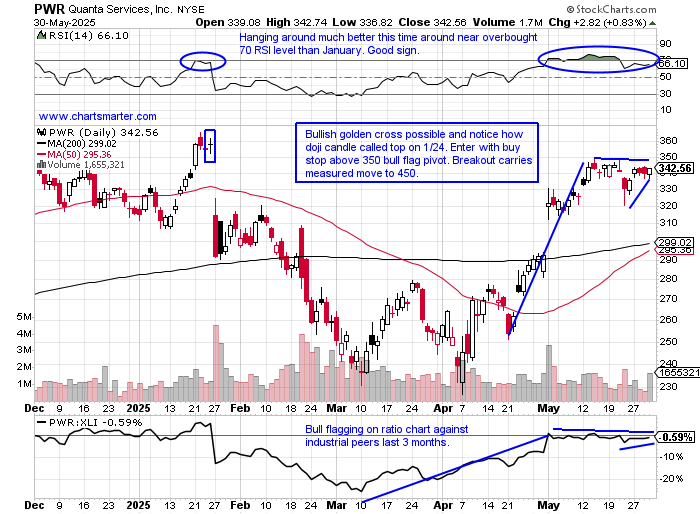
- Name 6% off most recent 52-week highs and WEEKLY chart shows filling in upside gap from week ending 1/24 that touched all-time highs. Traded in tightest WEEKLY range (less than 2%) in at least one year, which was preceded by spinning top week before. Add to above cup base pivot of 365.84.
- Earnings reactions mostly lower off 3.7, 3.2, and 4% on 2/20, 10/31, and 8/1/24 and rose 10% on 5/1.
- Enter with buy stop above bull flag.
- Entry PWR 350. Stop 336.
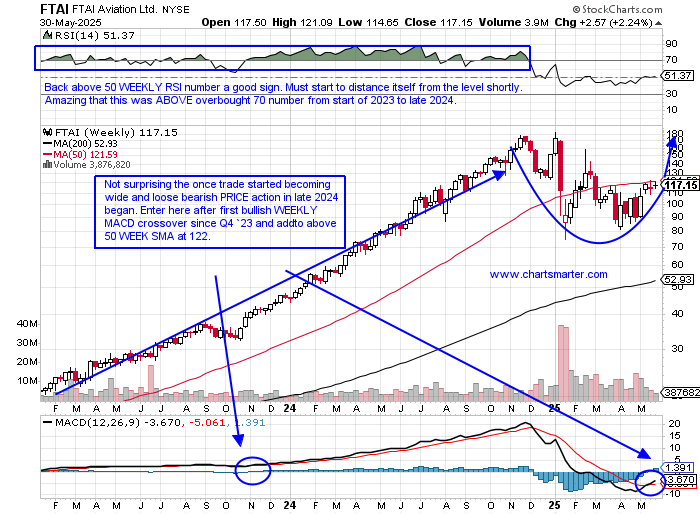
FTAI Aviation:
- Rental and leasing play down 19% YTD and up 39% over last one year period. Dividend yield of 1%.
- Name 36% off most recent 52-week highs and DAILY chart shows bears have had 4 chances to push this lower with huge distribution in the last 6 months but have been unable to do so. Above 200-day SMA can start building right side of cup base.
- Earnings reactions mostly lower off 18.9, 7.6, and 7.5% on 5/1, 2/27, 10/31/24 after a gain of 1.3% on 7/24/24.
- Enter after bullish WEEKLY MACD crossover.
- Entry FTAI here. Stop 109.
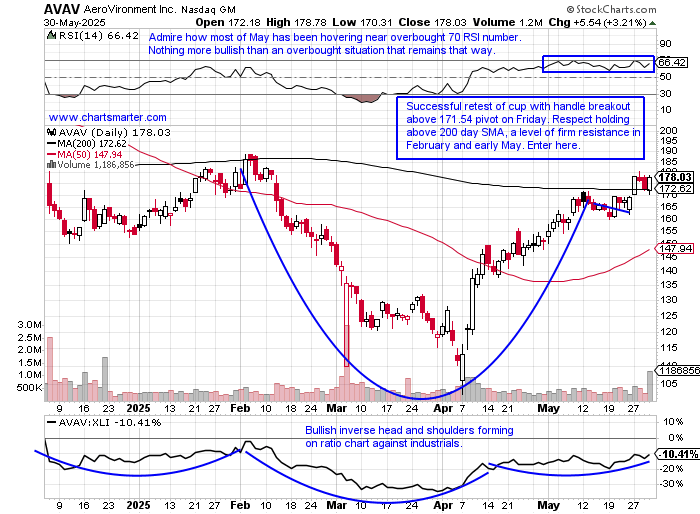
AeroVironment:
- Aerospace/defense play up 16% YTD and down 12% over last one year period.
- Name 25% off most recent 52-week highs and WEEKLY chart shows nice sprint off very round par number the week ending 4/11 that jumped more than 30%. Last week just second WEEKLY CLOSE above 50 WEEK SMA. Add to with buy stop above double bottom pivot of 188.89.
- FOUR straight negative earnings reactions off 4.4, 15.9, 5.3, and 7.7% on 3/5, 12/5, 9/5, and 6/27/24.
- Enter after break above cup with handle/200-day SMA.
- Entry AVAV here. Stop 169.
Good luck.
Entry summaries:
Buy stop above bull flag PWR 350. Stop 336.
Buy after bullish WEEKLY MACD crossover FTAI here. Stop 109.
Buy after break above cup with handle/200-day SMA AVAV here. Stop 169.
Turbulence Ahead?
- The airline group inside the diversified industrial space is at a familiar altitude, pun intended. The daily chart below of the JETS shows it in a tight range between 21-23 the last 3 weeks, an area it traded within in early to late March. Interestingly this ETF did not bottom like the overall market did on 4/7, but on 4/9 flying more than 17% in well more than double the average daily volume. Looking at its MONTHLY chart May completed a bullish morning star pattern, after a hammer candle in April and notice the bearish evening star completed in August 2023 with the rare doji in July (three others occurred near the top of the last decade in February, July, and December 2019). Influential stocks in the group include LUV, and talking about how dojis are well known for projecting tops (or bottoms near lows) at highs did so on 3/24. It is just above a cup with handle trigger of 32.99, although it did record 3 straight dubious candles to end last week with a doji, shooting star, and a spinning top. Not a traditional airline, but an aviation disrupter in JOBY is worth a look. The single-digit name, not my cup of tea, could be taken advantage on the long side with a gap fill near 7 from the 5/27 session. Notice it was halted at the very round 10 number with just one CLOSE above on 1/7, but this could be headed back there sometime in the second half, especially after the confidence boost after the TM investment.
Nuclear Move:
Unless one was hiding under a rock they would have missed the "nuclear" jump on 5/23 when the Trump administration signaled its affinity for the energy source. Individual names like OKLO which bulls will say is 3 days into forming a legitimate handle on a cup base with a potential pivot of 57.67 (bears will claim double top near round 60 number) stormed higher by more than 200% during its current 6 week winning streak. CCJ is still comfortably above a bull flag breakout pivot of 54 which carries a measured move to 69, but with the spinning top and doji candle on 5/28-29 may need some back and filling before resuming its uptrend. LTBR, a smaller speculative play, was subject to round number theory breaking above a 10.39 double bottom pivot before retesting the very round 10 number before jumping a rapid 70%. Below is the WEEKLY chart of BWXT, considered the "picks and shovels" play of the space and this is honing in on a double bottom breakout trigger. Its DAILY chart would be served best if it can consolidate the firm advance and form a bull flag. If that should occur look for a move to 150 later in the second half.
Recent Examples:
- For a long time, transport names have lagged. This is usually a sign of an unhealthy economy. Perhaps modes of transportation have changed with technology, but the emergence of some good charts in the railroad space is a welcome sign. There is some bifurcation among the small group but on the performance chart here on a YTD basis there is a clear winner and that is where one should look to deploy their hard-earned capital. That would be the daily chart of CP and how it appeared in our 5/28 Industrial Note. It has advanced 13% thus far in 2025 and although it has not broken above the suggested bull flag of 82 it is hovering right near it as of Friday's CLOSE. The stock is "just" 7% off its most recent 52-week highs, but all four rivals, CSX, NSC, UNP, and CNI, are between 11-18% off the annual peaks. Respect how it finished May right at highs for the month and it should now gravitate toward the add-on buy point above the double-bottom trigger of 86.65 into the end of Q2 beginning of Q3.
Special Situations:
Quanta Services:
- Engineering and construction leader up 8% YTD and 24% over last one year period. Dividend yield of .1%.
- Name 6% off most recent 52-week highs and WEEKLY chart shows filling in upside gap from week ending 1/24 that touched all-time highs. Traded in tightest WEEKLY range (less than 2%) in at least one year, which was preceded by spinning top week before. Add to above cup base pivot of 365.84.
- Earnings reactions mostly lower off 3.7, 3.2, and 4% on 2/20, 10/31, and 8/1/24 and rose 10% on 5/1.
- Enter with buy stop above bull flag.
- Entry PWR 350. Stop 336.
FTAI Aviation:
- Rental and leasing play down 19% YTD and up 39% over last one year period. Dividend yield of 1%.
- Name 36% off most recent 52-week highs and DAILY chart shows bears have had 4 chances to push this lower with huge distribution in the last 6 months but have been unable to do so. Above 200-day SMA can start building right side of cup base.
- Earnings reactions mostly lower off 18.9, 7.6, and 7.5% on 5/1, 2/27, 10/31/24 after a gain of 1.3% on 7/24/24.
- Enter after bullish WEEKLY MACD crossover.
- Entry FTAI here. Stop 109.
AeroVironment:
- Aerospace/defense play up 16% YTD and down 12% over last one year period.
- Name 25% off most recent 52-week highs and WEEKLY chart shows nice sprint off very round par number the week ending 4/11 that jumped more than 30%. Last week just second WEEKLY CLOSE above 50 WEEK SMA. Add to with buy stop above double bottom pivot of 188.89.
- FOUR straight negative earnings reactions off 4.4, 15.9, 5.3, and 7.7% on 3/5, 12/5, 9/5, and 6/27/24.
- Enter after break above cup with handle/200-day SMA.
- Entry AVAV here. Stop 169.
Good luck.
Entry summaries:
Buy stop above bull flag PWR 350. Stop 336.
Buy after bullish WEEKLY MACD crossover FTAI here. Stop 109.
Buy after break above cup with handle/200-day SMA AVAV here. Stop 169.