Conservative Stance?
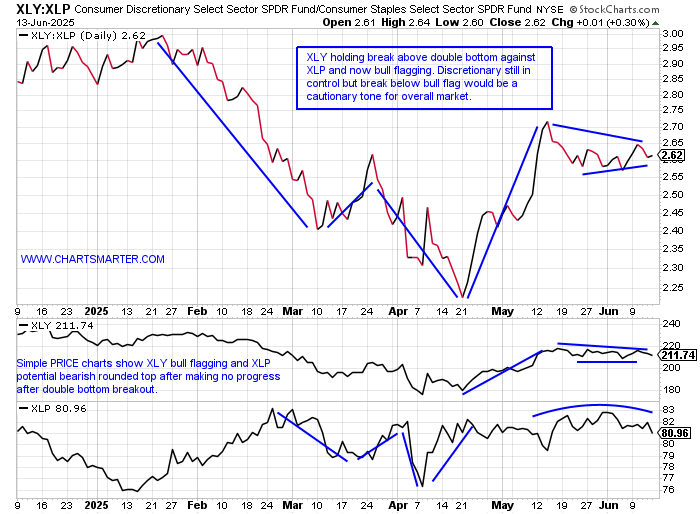
- There are a myriad of ways that investors determine if the market is in a risk on or off environment, and one of them is the ratio chart below comparing consumer discretionary to staples. The XLY is still in firm control as it bull flags but things can quickly change if the pattern breaks to the downside as we know from FALSE moves can often come fast one's in the opposite direction. I was surprised to see just how weak some of the staple names have been including former COVID favorite CLX which has fallen 23 of the last 29 weeks and even the bullish morning star completed the week ending 2/21 could not give the name a bounce (notice doji candle week ending 2/14 too). CPB is lower 8 of the last 9 months, since a bearish shooting star at the very round 50 number last September, and June so far is looking for its first CLOSE below its 200 MONTH SMA in at least a decade and is now trading below the COVID era depths. Sure one would expect these to lag after a vigorous 2-month rally but as the XLP trades just 4% off its most recent 52-week highs CLX and CPB are 28 and 38% off their most respective annual peaks, very poor relative strength.
Chinese Bifurcation:
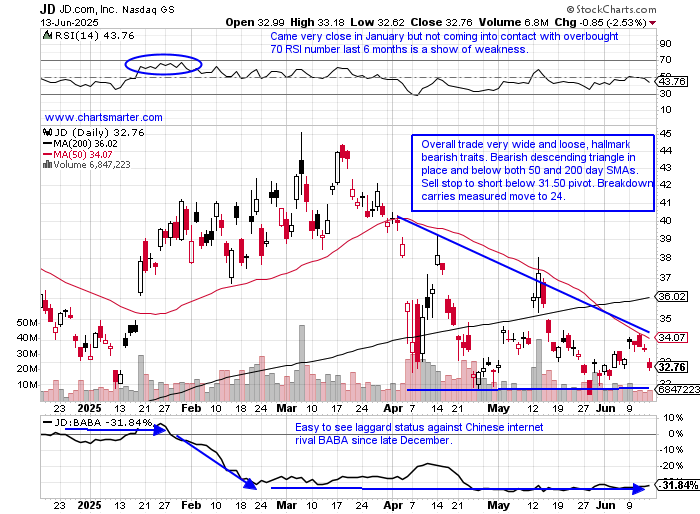
- In Q1 there was a lot of chatter that international stocks were outperforming domestic names and that can be seen looking at the ratio chart comparing KWEB to the FDN (domestic consumer internet plays). Since mid-March US-centric stocks have been back in the driver's seat, and both KWEB and FDN traded in tandem with the exception of mid-February to mid-March. A curious relationship on the Chinese side has been the relative weakness in JD, especially to rival BABA. So far in 2025, nearly half done, BABA has advanced 33%, as JD has fallen 6%. The MONTHLY chart of JD shows it on a 3 month losing streak with all 3 CLOSING hard upon their lows. It is plausible that this could retreat toward the very round 20 level last seen with a bullish morning star recorded there in March of 2024 (doji candle in February correctly called the possible change from the prevailing direction). Notice on the MONTHLY ratio chart JD has struggled against BABA since the start of 2022, so the recent weak relationship is nothing new, and we know trends once in place are more likely to continue than reverse course.
Recent Examples:
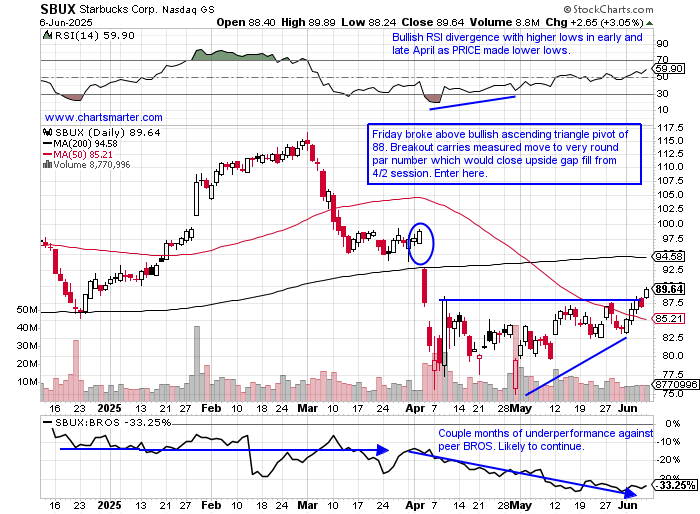
- The casual diner space had a big shake-up when Brian Niccol jumped ship from CMG to SBUX in August 24. That move created a huge jump of 24.5% on 8/13 recording a bullish island reversal (after the gap down on 5/1/24). CMG did outshine SBUX in March and April as seen on the ratio chart, but it is back to lagging and notice it registered a bull trap breaking briefly above an inverse head and shoulders formation on 6/5 putting up a bearish shooting star candle. It is now threatening to lose both the very round 50 number and 50-day SMA. Below is the daily chart of SBUX and how it appeared in our 6/9 Consumer Note. The break above the ascending triangle had some legs but did run into some issues at the 200-day SMA late last week. Last Thursday and Friday traded inside the 6/11 session which rose more than 4%. Give SBUX some credit in June as it has broken above a 3-month downtrend against best-in-breed BROS and last week came into contact with the overbought 70 RSI number not long after trading below the oversold 30 level. We know PRICE can appreciate well after that type of action and I think par is in its future at the beginning of Q3.
Special Situations:
Nintendo:
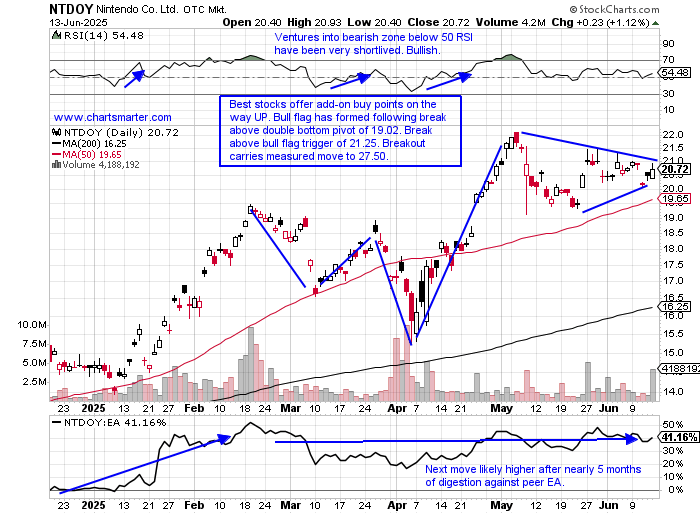
- Japanese entertainment play up 42% YTD and 55% over last one year period.
- Name 6% off most recent 52-week highs and MONTHLY chart shows outperformance against peer EA for the last decade and really accelerating in 2025. Firm action following break above 4 year long 14.82 cup base trigger this January.
- FOUR straight negative earnings reactions off 2.9, .4, 1.8, and 10% on 5/8, 2/4, 11/5, and 8/2/24.
- Enter with buy stop above bull flag.
- Entry NTDOY 21.25. Stop 19.75.
Texas Roadhouse:
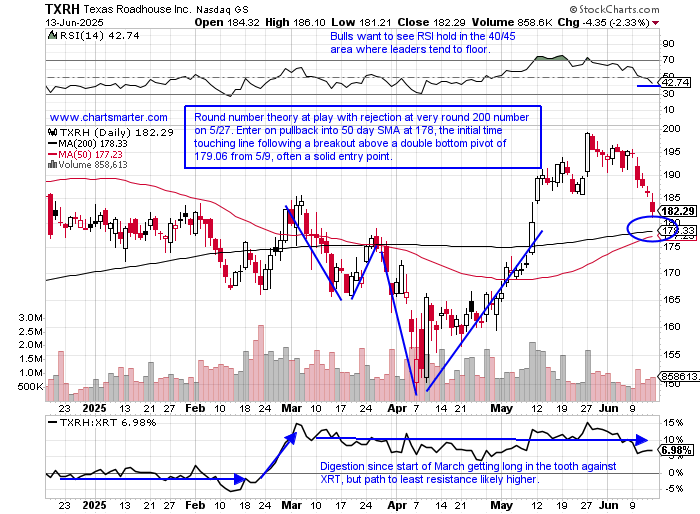
- Casual diner up 1% YTD and 9% over last one year period. Dividend yield of 1.5%.
- Name 12% off most recent 52-week highs and performance chart against restaurants rivals over the last 200 days like MCD, CMG, WEN, CAVA, and SG shows TXRH holding up best. MONTHLY chart shows June giving little back so far of bullish morning star completed in May.
- Earnings reactions mostly higher up 4.8, 3.6, and 2% on 5/9, 10/25, and 7/26/24 and fell 1.4% on 2/21.
- Enter on first touch of rising 50-day SMA following recent breakout.
- Entry TXRH 178. Stop 172.
Cava Group:
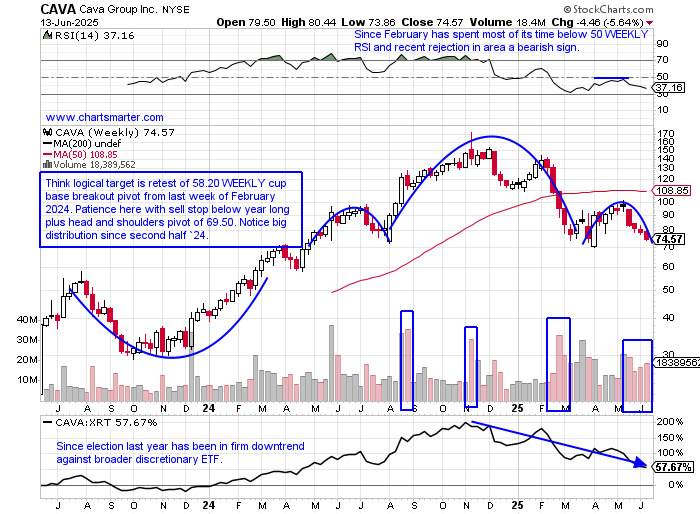
- Casual diner down 34% YTD and 17% over last one year period.
- Name 57% off most recent 52-week highs and DAILY chart shows doji candle correctly predicting downfall at very round par number on 5/13. Declined 17 of last 22 sessions and bullish harami cross completed on 6/6 did not halt downtrend. Notice stock was cut in half as RSI was BELOW oversold 30 number.
- Earnings reactions mixed falling 2.3 and .3% on 5/16 and 2/26 and rose 1.6 and 19.6% on 11/13 and 8/23/24.
- Enter short with sell stop below WEEKLY bearish head and shoulders formation.
- Entry CAVA 69.50. Buy stop 75.
Good luck.
Entry summaries:
Buy stop above bull flag NTDOY 21.25. Stop 19.75.
Buy first touch of rising 50-day SMA following recent breakout TXRH 178. Sto 172.
Short with sell stop below WEEKLY bearish head and shoulders formation CAVA 69.50. Buy stop 75.
This article requires a Chartsmarter membership. Please click here to join.
Conservative Stance?
- There are a myriad of ways that investors determine if the market is in a risk on or off environment, and one of them is the ratio chart below comparing consumer discretionary to staples. The XLY is still in firm control as it bull flags but things can quickly change if the pattern breaks to the downside as we know from FALSE moves can often come fast one's in the opposite direction. I was surprised to see just how weak some of the staple names have been including former COVID favorite CLX which has fallen 23 of the last 29 weeks and even the bullish morning star completed the week ending 2/21 could not give the name a bounce (notice doji candle week ending 2/14 too). CPB is lower 8 of the last 9 months, since a bearish shooting star at the very round 50 number last September, and June so far is looking for its first CLOSE below its 200 MONTH SMA in at least a decade and is now trading below the COVID era depths. Sure one would expect these to lag after a vigorous 2-month rally but as the XLP trades just 4% off its most recent 52-week highs CLX and CPB are 28 and 38% off their most respective annual peaks, very poor relative strength.
Chinese Bifurcation:
- In Q1 there was a lot of chatter that international stocks were outperforming domestic names and that can be seen looking at the ratio chart comparing KWEB to the FDN (domestic consumer internet plays). Since mid-March US-centric stocks have been back in the driver's seat, and both KWEB and FDN traded in tandem with the exception of mid-February to mid-March. A curious relationship on the Chinese side has been the relative weakness in JD, especially to rival BABA. So far in 2025, nearly half done, BABA has advanced 33%, as JD has fallen 6%. The MONTHLY chart of JD shows it on a 3 month losing streak with all 3 CLOSING hard upon their lows. It is plausible that this could retreat toward the very round 20 level last seen with a bullish morning star recorded there in March of 2024 (doji candle in February correctly called the possible change from the prevailing direction). Notice on the MONTHLY ratio chart JD has struggled against BABA since the start of 2022, so the recent weak relationship is nothing new, and we know trends once in place are more likely to continue than reverse course.
Recent Examples:
- The casual diner space had a big shake-up when Brian Niccol jumped ship from CMG to SBUX in August 24. That move created a huge jump of 24.5% on 8/13 recording a bullish island reversal (after the gap down on 5/1/24). CMG did outshine SBUX in March and April as seen on the ratio chart, but it is back to lagging and notice it registered a bull trap breaking briefly above an inverse head and shoulders formation on 6/5 putting up a bearish shooting star candle. It is now threatening to lose both the very round 50 number and 50-day SMA. Below is the daily chart of SBUX and how it appeared in our 6/9 Consumer Note. The break above the ascending triangle had some legs but did run into some issues at the 200-day SMA late last week. Last Thursday and Friday traded inside the 6/11 session which rose more than 4%. Give SBUX some credit in June as it has broken above a 3-month downtrend against best-in-breed BROS and last week came into contact with the overbought 70 RSI number not long after trading below the oversold 30 level. We know PRICE can appreciate well after that type of action and I think par is in its future at the beginning of Q3.
Special Situations:
Nintendo:
- Japanese entertainment play up 42% YTD and 55% over last one year period.
- Name 6% off most recent 52-week highs and MONTHLY chart shows outperformance against peer EA for the last decade and really accelerating in 2025. Firm action following break above 4 year long 14.82 cup base trigger this January.
- FOUR straight negative earnings reactions off 2.9, .4, 1.8, and 10% on 5/8, 2/4, 11/5, and 8/2/24.
- Enter with buy stop above bull flag.
- Entry NTDOY 21.25. Stop 19.75.
Texas Roadhouse:
- Casual diner up 1% YTD and 9% over last one year period. Dividend yield of 1.5%.
- Name 12% off most recent 52-week highs and performance chart against restaurants rivals over the last 200 days like MCD, CMG, WEN, CAVA, and SG shows TXRH holding up best. MONTHLY chart shows June giving little back so far of bullish morning star completed in May.
- Earnings reactions mostly higher up 4.8, 3.6, and 2% on 5/9, 10/25, and 7/26/24 and fell 1.4% on 2/21.
- Enter on first touch of rising 50-day SMA following recent breakout.
- Entry TXRH 178. Stop 172.
Cava Group:
- Casual diner down 34% YTD and 17% over last one year period.
- Name 57% off most recent 52-week highs and DAILY chart shows doji candle correctly predicting downfall at very round par number on 5/13. Declined 17 of last 22 sessions and bullish harami cross completed on 6/6 did not halt downtrend. Notice stock was cut in half as RSI was BELOW oversold 30 number.
- Earnings reactions mixed falling 2.3 and .3% on 5/16 and 2/26 and rose 1.6 and 19.6% on 11/13 and 8/23/24.
- Enter short with sell stop below WEEKLY bearish head and shoulders formation.
- Entry CAVA 69.50. Buy stop 75.
Good luck.
Entry summaries:
Buy stop above bull flag NTDOY 21.25. Stop 19.75.
Buy first touch of rising 50-day SMA following recent breakout TXRH 178. Sto 172.
Short with sell stop below WEEKLY bearish head and shoulders formation CAVA 69.50. Buy stop 75.