Healthcare names have been acting very well, especially small caps. Stocks like NKTR, FATE or ATRA to name a few all have had nice runs recently. Compare their YTD performances with large cap laggards such as CELG or BIIB and the picture becomes clearer. Of course the smaller names are more nimble and can make changes quickly that the mega cap supertankers can not, but nonetheless pay attention to PRICE. Today we are going to look at another small cap play, a former best of breed healthcare stock, RGEN. While this one is lacking the thrust of the aforementioned small cap peers its chart looks intriguing here if it can climb back above its 200 day SMA which it is approaching. Directly below is the chart precisely how it appeared in our Wednesday 2/28 Game Plan and then at the bottom of the post we take a current view.
Stock regrouping after failure to hold 42.58 cup base trigger taken out week ending 6/23/17 in a base nearly 2 years long beginning week ending 7/3/15. RGENis a healthcare name lower by 2% YTD and higher by 9% over the last one year period. Earnings have been mostly higher with gains of 8, 1.1 and 6.2% on 2/22, 8/3 and 5/4 and a loss of 3.2% on 11/9. The stock is higher the last 2 weeks impressively by 5.9 and 8%, but to be fair lost almost 17% the 2 weeks before that. The round numbers have come into play as nice bottoms with the 20 figure the week ending 2/12/16 and 30 the week ending 2/9/18. It has recorded three bullish hammers between 2/22-26 and is holding its 50 day SMA each of those sessions too. RGEN is now back above 34 trigger in a long bullish ascending triangle formation that began the week ending 10/30/15 and was taken out the week ending 3/17/17. Enter here.
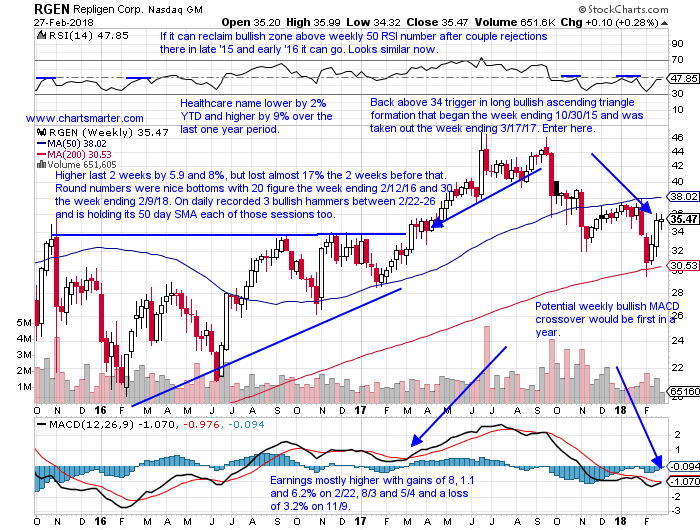
Trigger RGEN here. Stop 34.
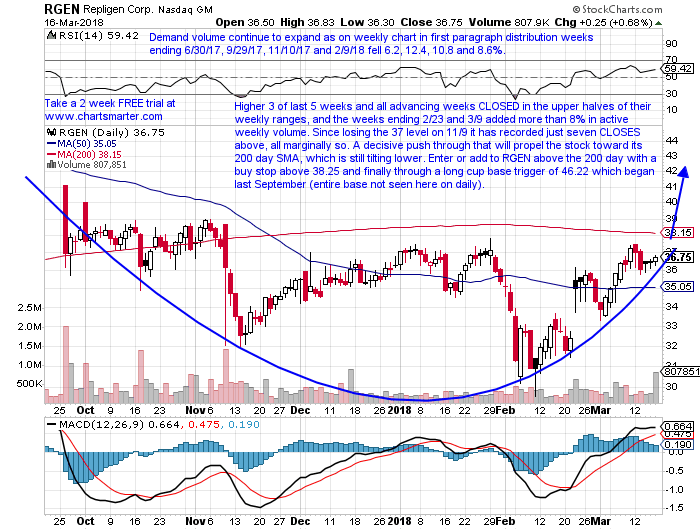
RGEN is now up 1% YTD and 9% over the last one year period. The stock is now higher 3 of the last 5 weeks and all of the advancing weeks CLOSED in the upper halves of their weekly ranges, and the weeks ending 2/23 and 3/9 added more than 8% in active weekly volume. Since losing the 37 level on 11/9 it has recorded just seven CLOSES above, all marginally so. A decisive push through that will propel the stock toward its 200 day SMA, which is still tilting lower. Enter or add to your RGEN above the 200 day with a buy stop above 38.25 (as always it must CLOSE above that trigger) and finally through a long cup base trigger of 46.22 which began last September.
If you liked what you read why not visit www.chartsmarter.com.
Healthcare names have been acting very well, especially small caps. Stocks like NKTR, FATE or ATRA to name a few all have had nice runs recently. Compare their YTD performances with large cap laggards such as CELG or BIIB and the picture becomes clearer. Of course the smaller names are more nimble and can make changes quickly that the mega cap supertankers can not, but nonetheless pay attention to PRICE. Today we are going to look at another small cap play, a former best of breed healthcare stock, RGEN. While this one is lacking the thrust of the aforementioned small cap peers its chart looks intriguing here if it can climb back above its 200 day SMA which it is approaching. Directly below is the chart precisely how it appeared in our Wednesday 2/28 Game Plan and then at the bottom of the post we take a current view.
Stock regrouping after failure to hold 42.58 cup base trigger taken out week ending 6/23/17 in a base nearly 2 years long beginning week ending 7/3/15. RGENis a healthcare name lower by 2% YTD and higher by 9% over the last one year period. Earnings have been mostly higher with gains of 8, 1.1 and 6.2% on 2/22, 8/3 and 5/4 and a loss of 3.2% on 11/9. The stock is higher the last 2 weeks impressively by 5.9 and 8%, but to be fair lost almost 17% the 2 weeks before that. The round numbers have come into play as nice bottoms with the 20 figure the week ending 2/12/16 and 30 the week ending 2/9/18. It has recorded three bullish hammers between 2/22-26 and is holding its 50 day SMA each of those sessions too. RGEN is now back above 34 trigger in a long bullish ascending triangle formation that began the week ending 10/30/15 and was taken out the week ending 3/17/17. Enter here.
Trigger RGEN here. Stop 34.
RGEN is now up 1% YTD and 9% over the last one year period. The stock is now higher 3 of the last 5 weeks and all of the advancing weeks CLOSED in the upper halves of their weekly ranges, and the weeks ending 2/23 and 3/9 added more than 8% in active weekly volume. Since losing the 37 level on 11/9 it has recorded just seven CLOSES above, all marginally so. A decisive push through that will propel the stock toward its 200 day SMA, which is still tilting lower. Enter or add to your RGEN above the 200 day with a buy stop above 38.25 (as always it must CLOSE above that trigger) and finally through a long cup base trigger of 46.22 which began last September.
If you liked what you read why not visit www.chartsmarter.com.