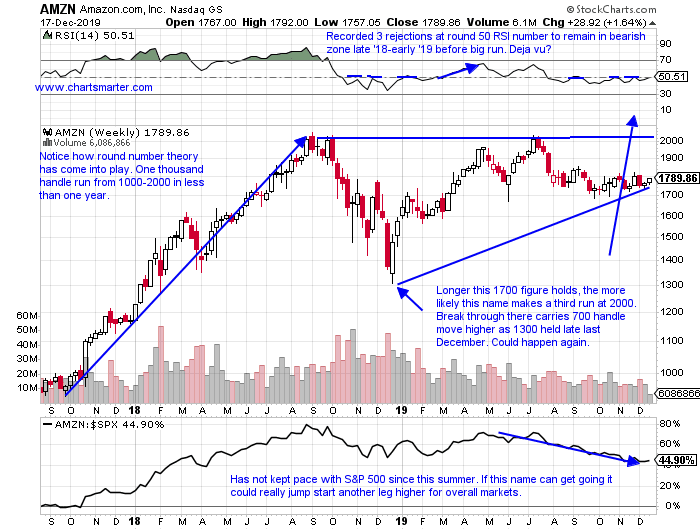
Amazon Blast Off?
- The Nasdaq ended an eleven session winning streak today at the very round 9000 number, and a string of 8 consecutive higher Fridays. It did record a bearish counterattack candle, but PRICE action always overrules anything else. And the tech heavy benchmark ignored a doji candle on Tuesday, and a number of spinning top candles during the winning streak. But all that being said it is now 500 handles above its rising 50 day SMA. Admire that it has gained 11 of the last 13 weeks, and the 2 down weeks fell less than a combined .4%. The largest component in the Nasdaq AAPL seems like it wants to come into contact with the round 300 number, and AMZN the 4th largest holding posted its best weekly gain since 4/26 up nearly 5%. It seems it is talked about more as a discretionary name these days, and it too has been affected by round number theory, being rejected at 1900 number Friday, and launched off 1800 Thursday. Below is the chart from our 12/18 Consumer Note, and it may be hitting the 2000 figure sooner than later.
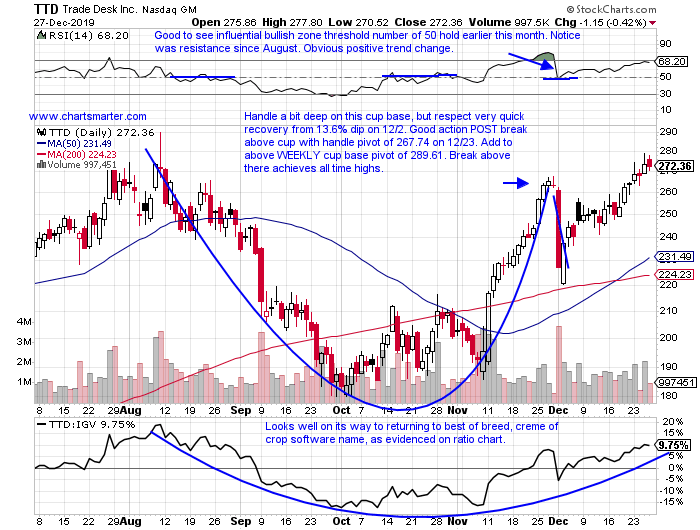
Acting "Soft" No More:
- Once a former best of breed name becomes a laggard, often times they do not resurrect themselves. Of course there are exceptions, and the once robust software group had plenty of casualties earlier in 2019. Among them was a powerhouse, in TTD, and below we take a look at its chart. Let us start by giving credit where it is due as it trades just 6% off most recent 52 week highs, while peers such as VMW WDAY and TWLO all trade 26, 27 and 34% off their most respective recent yearly peaks. They say nothing good happens beneath the 200 day SMA, but notice this name quickly recaptured it, and then when retested the line bounced off it like a pro on 12/3. There are tons of stops around big moving averages, so one has to give a small bit of leeway around them. If one is going to dedicate capital to the software group, TTD has deserved it. The stock does not fly under the radar, but was surprised to see it is not in the top 10 components of the IGV.
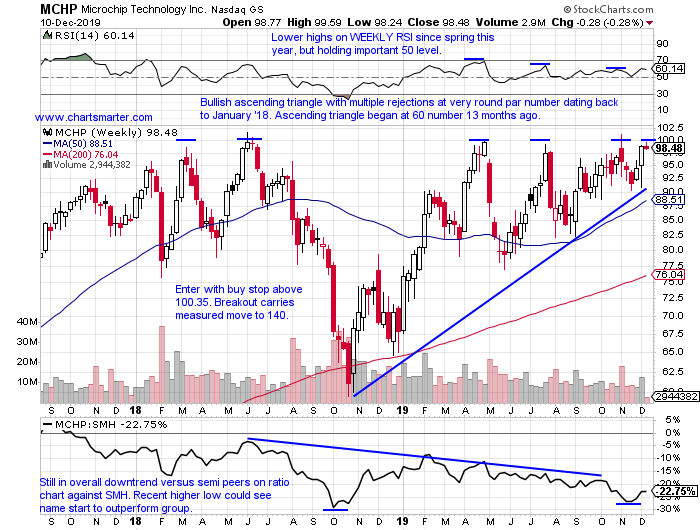
Recent Examples:
- Many investors have differing views, and that is what makes markets. One of my beliefs is that the more times a line of support, or resistance, is touched the firmer it becomes. I believe the opposite, that when that occurs the softer the foundation becomes. When that happens it conjunction with a very round number, the potential of a break above or below a line can have added meaning. Below is a good example of that with the chart of MCHP and how it appeared in our 12/11 Technology Note. Notice the very round par figure was resistance dating back nearly 2 years. Once the level was taken out, it has rallied more than 5%. The 100 figure, long resistance, should now become support, and this is a good risk/reward scenario in my opinion here. Of course it does not hurt that it hails from the white hot semiconductor space.
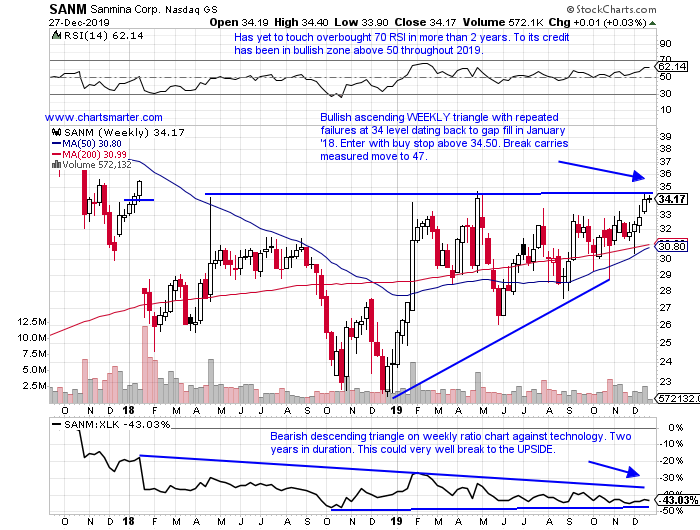
Special Situations:
- Electronic components play higher by 42% YTD and 43% over last one year period.
- Five week winning streak, and last 3 have been in vicinity of 34 number. Last 3 times that occurred in April '18, February and May '19 it backed off quickly. Good sign.
- Fell 3.3% last earnings reaction on 10/29, but prior FOUR all advanced by .4, 15.2, 16.9 and 7.4% on 7/30, 4/30, 1/29 and 10/30/18.
- Enter with buy stop above WEEKLY ascending triangle. Break carries measured move to 47.
- Entry SANM 34.50. Stop 32.25.
- Software name just more than one year old, higher by 97% YTD and 94% over last one year period.
- Lower 3 of the last 5 weeks, and now 12% off most recent 52 week highs, but all 5 have traded within range of week ending 11/22 that rose 11.4%.
- Four of only five earnings reactions very well received up 8, 18.2, 10.3 and 11.1% on 11/21, 5/28, 2/25 and 11/28/18.
- Enter here after recent gap fill, and bullish candles at very round 50 number.
- Entry PLAN here. Stop 48.

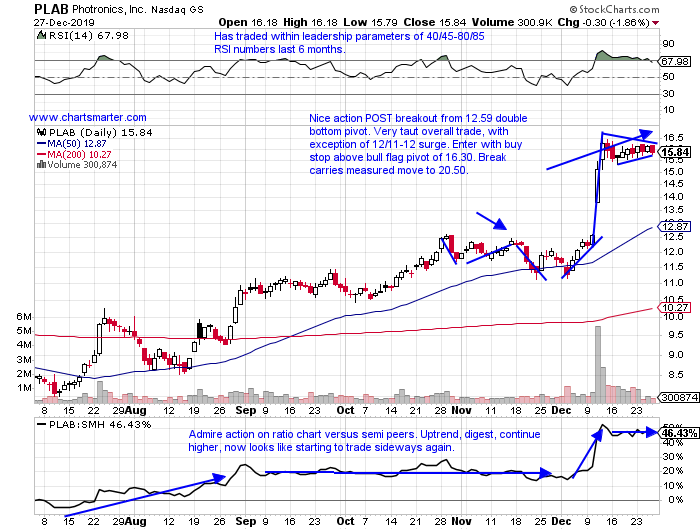
- Small cap semiconductor higher by 63% YTD and 64% over last one year period.
- Last 2 weeks have beautifully digested the 29.1% weekly gain ending 12/13. Last 3 weeks have all CLOSED very taut within just .14 of each other.
- Three consecutive positive earnings reactions up 20.4, 1.1 and 5.6% on 12/11, 8/20 and 5/22.
- Enter with buy stop above bull flag pivot. Break carries measured move to 20.50.
- Entry PLAB 16.30. Stop 15.50.
Good luck.
Entry summaries:
Buy stop above WEEKLY bullish ascending triangle SANM 34.50. Stop 32.25.
Buy after recent successful gap fill at very round 50 number PLAN here. Stop 48.
Buy stop above bull flag PLAB 16.30. Stop 15.50.
This article requires a Chartsmarter membership. Please click here to join.
Amazon Blast Off?
- The Nasdaq ended an eleven session winning streak today at the very round 9000 number, and a string of 8 consecutive higher Fridays. It did record a bearish counterattack candle, but PRICE action always overrules anything else. And the tech heavy benchmark ignored a doji candle on Tuesday, and a number of spinning top candles during the winning streak. But all that being said it is now 500 handles above its rising 50 day SMA. Admire that it has gained 11 of the last 13 weeks, and the 2 down weeks fell less than a combined .4%. The largest component in the Nasdaq AAPL seems like it wants to come into contact with the round 300 number, and AMZN the 4th largest holding posted its best weekly gain since 4/26 up nearly 5%. It seems it is talked about more as a discretionary name these days, and it too has been affected by round number theory, being rejected at 1900 number Friday, and launched off 1800 Thursday. Below is the chart from our 12/18 Consumer Note, and it may be hitting the 2000 figure sooner than later.
Acting "Soft" No More:
- Once a former best of breed name becomes a laggard, often times they do not resurrect themselves. Of course there are exceptions, and the once robust software group had plenty of casualties earlier in 2019. Among them was a powerhouse, in TTD, and below we take a look at its chart. Let us start by giving credit where it is due as it trades just 6% off most recent 52 week highs, while peers such as VMW WDAY and TWLO all trade 26, 27 and 34% off their most respective recent yearly peaks. They say nothing good happens beneath the 200 day SMA, but notice this name quickly recaptured it, and then when retested the line bounced off it like a pro on 12/3. There are tons of stops around big moving averages, so one has to give a small bit of leeway around them. If one is going to dedicate capital to the software group, TTD has deserved it. The stock does not fly under the radar, but was surprised to see it is not in the top 10 components of the IGV.
Recent Examples:
- Many investors have differing views, and that is what makes markets. One of my beliefs is that the more times a line of support, or resistance, is touched the firmer it becomes. I believe the opposite, that when that occurs the softer the foundation becomes. When that happens it conjunction with a very round number, the potential of a break above or below a line can have added meaning. Below is a good example of that with the chart of MCHP and how it appeared in our 12/11 Technology Note. Notice the very round par figure was resistance dating back nearly 2 years. Once the level was taken out, it has rallied more than 5%. The 100 figure, long resistance, should now become support, and this is a good risk/reward scenario in my opinion here. Of course it does not hurt that it hails from the white hot semiconductor space.
Special Situations:
- Electronic components play higher by 42% YTD and 43% over last one year period.
- Five week winning streak, and last 3 have been in vicinity of 34 number. Last 3 times that occurred in April '18, February and May '19 it backed off quickly. Good sign.
- Fell 3.3% last earnings reaction on 10/29, but prior FOUR all advanced by .4, 15.2, 16.9 and 7.4% on 7/30, 4/30, 1/29 and 10/30/18.
- Enter with buy stop above WEEKLY ascending triangle. Break carries measured move to 47.
- Entry SANM 34.50. Stop 32.25.
- Software name just more than one year old, higher by 97% YTD and 94% over last one year period.
- Lower 3 of the last 5 weeks, and now 12% off most recent 52 week highs, but all 5 have traded within range of week ending 11/22 that rose 11.4%.
- Four of only five earnings reactions very well received up 8, 18.2, 10.3 and 11.1% on 11/21, 5/28, 2/25 and 11/28/18.
- Enter here after recent gap fill, and bullish candles at very round 50 number.
- Entry PLAN here. Stop 48.
- Small cap semiconductor higher by 63% YTD and 64% over last one year period.
- Last 2 weeks have beautifully digested the 29.1% weekly gain ending 12/13. Last 3 weeks have all CLOSED very taut within just .14 of each other.
- Three consecutive positive earnings reactions up 20.4, 1.1 and 5.6% on 12/11, 8/20 and 5/22.
- Enter with buy stop above bull flag pivot. Break carries measured move to 20.50.
- Entry PLAB 16.30. Stop 15.50.
Good luck.
Entry summaries:
Buy stop above WEEKLY bullish ascending triangle SANM 34.50. Stop 32.25.
Buy after recent successful gap fill at very round 50 number PLAN here. Stop 48.
Buy stop above bull flag PLAB 16.30. Stop 15.50.