- The bullish ascending triangle is just as it sounds as a triangle takes shape with a horizontal line on top that acts as resistance, and the bottom line is sloping upward, making higher lows along the way. This could form in either uptrends, or as a bottoming pattern. The entry would be a decisive breakout above the top horizontal line which will normally come into contact at least 2 to 3 times. There is a debate in technical analysis, about whether the more times a line of support or resistance is touched, does that support or resistance become stronger or weaker? I say the latter. In this pattern we get an implied move by taking the depth of the formation and its greatest distance and add it to the breakout. Lets take a look at a few recent examples.
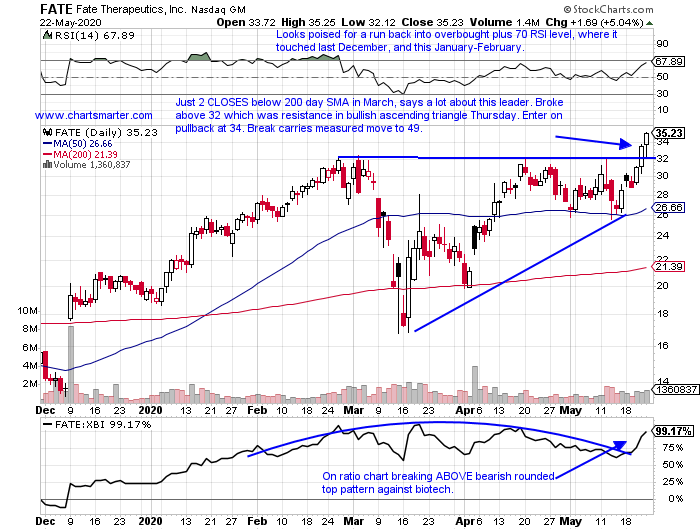
In our 5/25 Healthcare Note we looked at FATE.
- Biotech play higher by 64% YTD and 59% over last one year period.
- Firm strength week ending 5/22 jumping 23.8% to an all time high (this week reversing). Prior 4 weeks digested strong 3 week winning streak weeks ending between 4/3/17 that rose by a combined 37%.
- Acting well despite FOUR straight negative earnings reactions, down 4.9, 8.9, 14.7 and 16.5% on 5/12, 3/3, 11/6 and 8/7/19.
- Enter here after recent break above bullish ascending triangle.
- Entry FATE 34. Stop 29.55. Currently below the 34 pivot and retesting the triangle breakout.
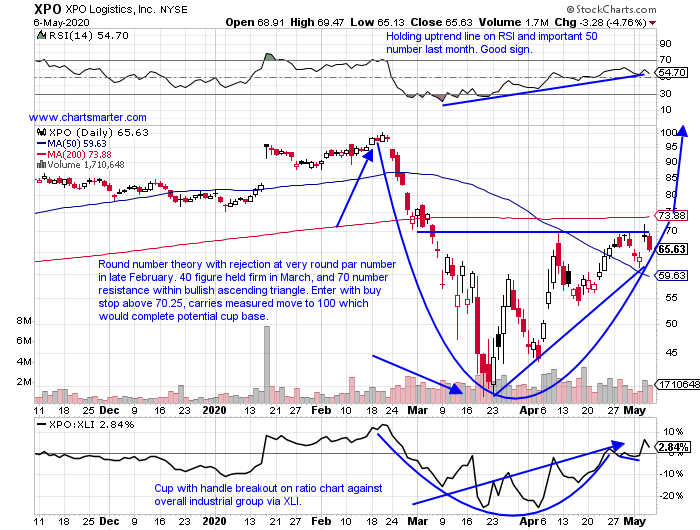
In our 5/7 Industrial Note we looked at XPO.
- Logistics play lower by 1% YTD and up 49% over last one year period.
- Still 22% off most recent 52 week highs, and following pattern of one week up one week down since huge 30% weekly gain week ending 3/27 (week ending 4/10 screamed higher by 39.8%). This week looking to break that pattern up 3.9% heading into Friday.
- Three of last four earnings reactions higher by 8, 1.2 and 11% on 5/5, 10/29 and 8/2/19 (fell 2% on 2/11).
- Enter with buy stop above bullish ascending triangle.
- Entry XPO 70.25. Stop 66. Now trading near 78, and may be looking to fill in the gap a few percentage points below near 200 day SMA.
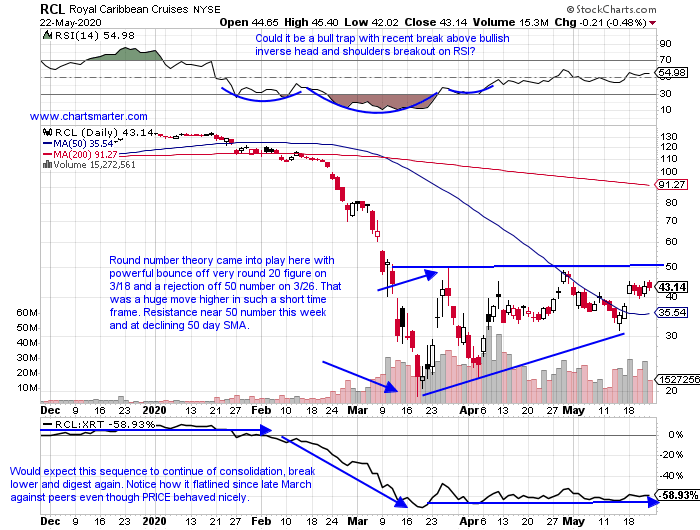
We wrote about RCL in a Consumer Note the first week in May.
- The cruise liners have been sailing through tumultuous seas recently, of course figuratively speaking as all boats remain tied to the docks. For traders that have caught these spectacular moves congratulations. In my opinion there are better fish to fry, but it is still interesting to see how they trade. Below is the chart of RCL, and it had been setting up a bullish ascending triangle with the round 50 number being the breakout area. Peer NCLH found a stern rejection, pun intended at the round 20 number on 3/26. All three of the major players now trade between 70-77% off their most recent 52 week highs, and CCL was the only one of the trio to undercut its 3/18 intraday low. Volume on all three of these players has expanded in a big way since mid February, as market participants try to game the oversized moves. Remember things are cheap for a reason, and I have no desire to play these names at all, but am wishing the companies and their employees good luck in the future. Carnival has been able to access capital through the bond market, although the yield they had to pay was significant. Fast forward to today and RCL broke above to 50 number on Thursday, and will be interesting to see how it CLOSES Friday.
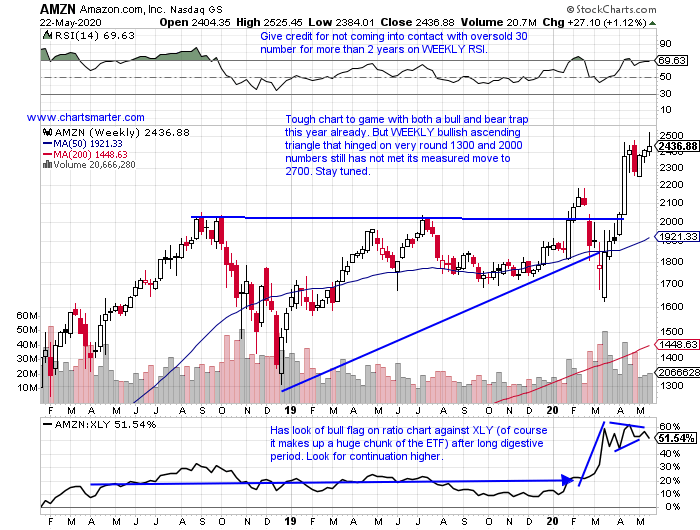
- And of course here we have one of the most visible names in the market today, in Amazon. There is a saying in technical analysis that the longer the base, the great the space, once the breakout is CONFIRMED. Below is a good example of that as a WEEKLY bullish ascending triangle that formed, dating back to the late summer of 2018. Notice how it developed around the very round 1300 and 2000 numbers, and that there were both bull and bear traps. The bull trap came this February, and then the bear trap the very next month, before a very powerful move above 2000 for good in mid April. Presently the stock is on a 5 session losing streak following the bearish engulfing candle on 5/21.
This article requires a Chartsmarter membership. Please click here to join.
- The bullish ascending triangle is just as it sounds as a triangle takes shape with a horizontal line on top that acts as resistance, and the bottom line is sloping upward, making higher lows along the way. This could form in either uptrends, or as a bottoming pattern. The entry would be a decisive breakout above the top horizontal line which will normally come into contact at least 2 to 3 times. There is a debate in technical analysis, about whether the more times a line of support or resistance is touched, does that support or resistance become stronger or weaker? I say the latter. In this pattern we get an implied move by taking the depth of the formation and its greatest distance and add it to the breakout. Lets take a look at a few recent examples.
In our 5/25 Healthcare Note we looked at FATE.
- Biotech play higher by 64% YTD and 59% over last one year period.
- Firm strength week ending 5/22 jumping 23.8% to an all time high (this week reversing). Prior 4 weeks digested strong 3 week winning streak weeks ending between 4/3/17 that rose by a combined 37%.
- Acting well despite FOUR straight negative earnings reactions, down 4.9, 8.9, 14.7 and 16.5% on 5/12, 3/3, 11/6 and 8/7/19.
- Enter here after recent break above bullish ascending triangle.
- Entry FATE 34. Stop 29.55. Currently below the 34 pivot and retesting the triangle breakout.
In our 5/7 Industrial Note we looked at XPO.
- Logistics play lower by 1% YTD and up 49% over last one year period.
- Still 22% off most recent 52 week highs, and following pattern of one week up one week down since huge 30% weekly gain week ending 3/27 (week ending 4/10 screamed higher by 39.8%). This week looking to break that pattern up 3.9% heading into Friday.
- Three of last four earnings reactions higher by 8, 1.2 and 11% on 5/5, 10/29 and 8/2/19 (fell 2% on 2/11).
- Enter with buy stop above bullish ascending triangle.
- Entry XPO 70.25. Stop 66. Now trading near 78, and may be looking to fill in the gap a few percentage points below near 200 day SMA.
We wrote about RCL in a Consumer Note the first week in May.
- The cruise liners have been sailing through tumultuous seas recently, of course figuratively speaking as all boats remain tied to the docks. For traders that have caught these spectacular moves congratulations. In my opinion there are better fish to fry, but it is still interesting to see how they trade. Below is the chart of RCL, and it had been setting up a bullish ascending triangle with the round 50 number being the breakout area. Peer NCLH found a stern rejection, pun intended at the round 20 number on 3/26. All three of the major players now trade between 70-77% off their most recent 52 week highs, and CCL was the only one of the trio to undercut its 3/18 intraday low. Volume on all three of these players has expanded in a big way since mid February, as market participants try to game the oversized moves. Remember things are cheap for a reason, and I have no desire to play these names at all, but am wishing the companies and their employees good luck in the future. Carnival has been able to access capital through the bond market, although the yield they had to pay was significant. Fast forward to today and RCL broke above to 50 number on Thursday, and will be interesting to see how it CLOSES Friday.
- And of course here we have one of the most visible names in the market today, in Amazon. There is a saying in technical analysis that the longer the base, the great the space, once the breakout is CONFIRMED. Below is a good example of that as a WEEKLY bullish ascending triangle that formed, dating back to the late summer of 2018. Notice how it developed around the very round 1300 and 2000 numbers, and that there were both bull and bear traps. The bull trap came this February, and then the bear trap the very next month, before a very powerful move above 2000 for good in mid April. Presently the stock is on a 5 session losing streak following the bearish engulfing candle on 5/21.