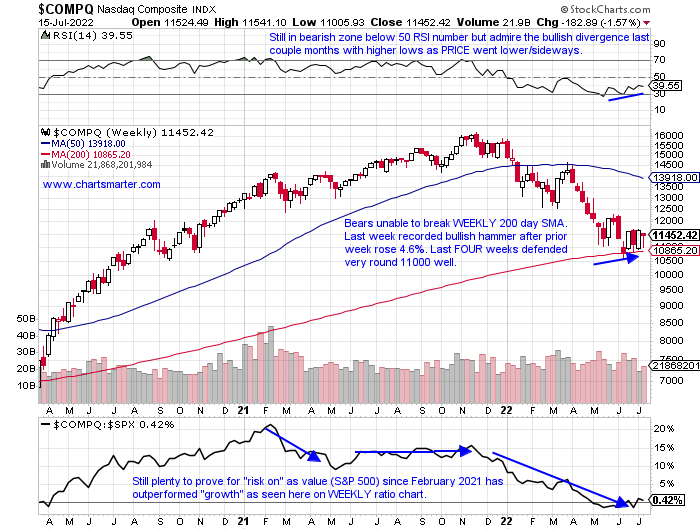
Tech Comeback?
- Any chance of a market rebound will need to include technology. As I have been saying for a few weeks now some green shoots are starting. And remember only liars pick bottoms, but some evidence is mounting of a comeback. The Nasdaq is now lower for 12 of the last 15 weeks, so it is still in a firm downtrend that must be respected, but some individual names are offering decent risk/reward with tight stops. AAPL is now back to the 150 number and added more than 2% this week as the Nasdaq slipped 1.6%. It did record a spinning top Friday which suggests it may need some back and filling. MSFT and GOOGL recorded dubious candles however as they were rejected at their 50-day SMAs. Other top holdings in the QQQ like TSLA and AMZN did the same thing. But the ETF did CLOSE at the top of its daily range with NVDA and AVGO helping as the SMH rose almost 3% last week. We are back to familiar resistance as it CLOSED last Friday, and the Friday before right at its 50-day SMA, of course, this time however was a lower high. There is still plenty of work to do but the longer-term WEEKLY chart shows if this 200-day SMA can continue to hold we may look back on this later in the year regretfully for those that did not take advantage.
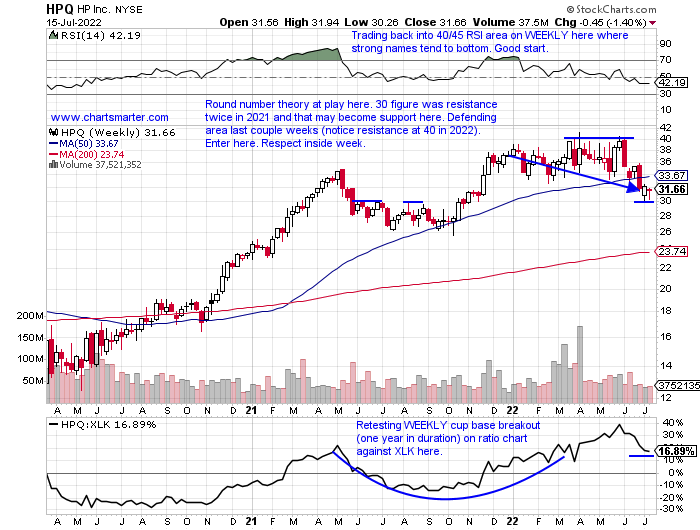
Round Number Juncture:
- "Old tech" name down 16% YTD and up 13% over the last one-year period. Dividend yield of 3.2%.
- Name 24% off most recent 52-week highs and lower 4 of the last 6 weeks. The last 3 weeks have all CLOSED very taut within just .44 of each other. Nice follow-through Friday after bullish engulfing candle day before.
- Earnings mixed with gains of 3.9 and 10.1% on 6/1 and 11/24/21 and losses of .8 and .6% on 3/1 and 8/27/21.
- Enter after defense of round number/former WEEKLY resistance.
- Entry HPQ here. Stop 28.
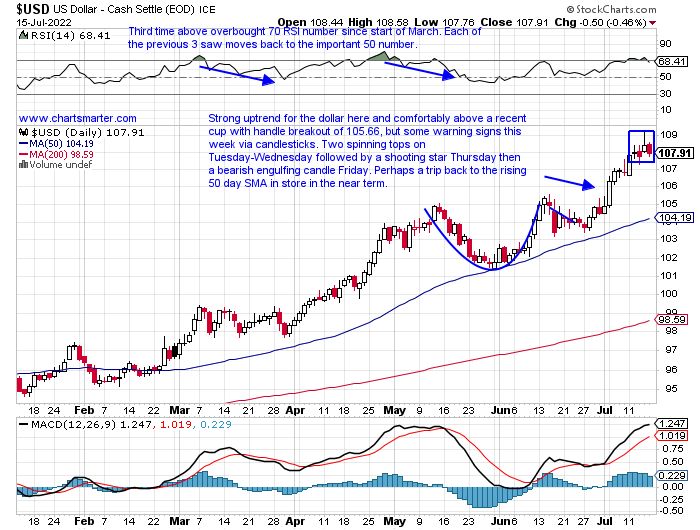
Greenback Setback?
- We have heard all the headlines about the US dollar, with the most popular one being it reaching parity with the Euro for the first time in 20 years. As the world around us looks to be falling apart investors still obviously believe in the "king dollar" and its calls for losing its global reserve currency status seem to be more and more wrong with each passing day. This is a blessing for anyone traveling overseas at the moment, but it has been a headwind for equities. On the daily chart below of the greenback, one can see some dubious candlestick between last Tuesday-Friday. If one looks at a WEEKLY chart it just broke above a long cup base at the 104 level that began in March 2020. My feeling is that this uptrend is not over, but it is showing signs of exhaustion. It is about as extended from its rising 50-day SMA as it has been in months and a pullback to that line would be welcoming for the markets.
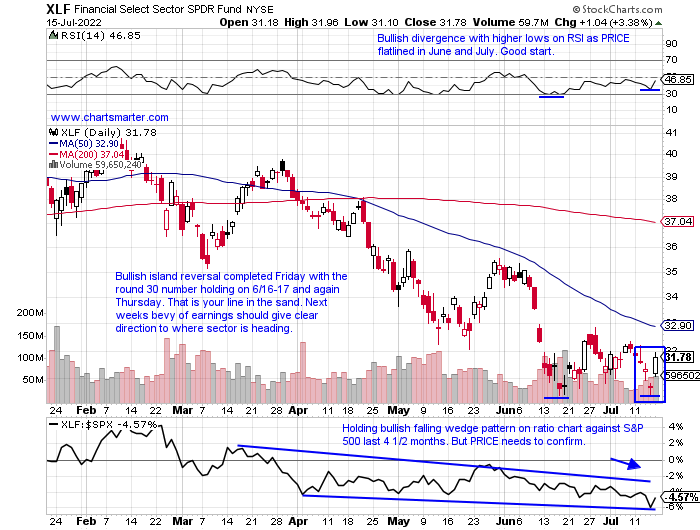
"Banking" On Gains:
- Earnings season for the group started late last week and Thursday did not get off to the best start. The XLF declined 1.9% on 7/14, but off session lows as it bounced off the round 30 number. That level was influential with plenty of PRICE memory as it was rough resistance the first 3 months of 2018 and then again between November '19-February '20. The ETF then pierced the 30 area to the upside to begin 2021 and here it is back there once again. Will support hold here? Only PRICE knows that and we should get some idea next week. Below is the chart and Friday did complete a bullish island reversal thanks to an unsung hero in C. Most likely shorts were caught off guard as the stock responded very kindly to numbers rising 13%, CLOSING just 2 pennies shy of the very round 50 number. It did also close an upside gap from the 6/9 session. WFC jumped 6% after its own well-received report, and Friday's action put the negative action in JPM and MS Thursday in the rearview mirror. Monday reactions from BAC GS and SCHW should give some further color into the space. The XLF may be saying the worst is behind it.
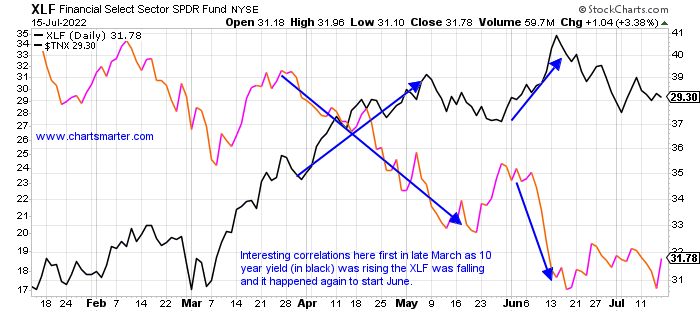
Yield Dilemma:
- One of the most well-known intermarket relationships was as interest rates rise banks should appreciate. As their net interest margins improve they should stand to benefit. But the chart below looking at the PRICE action of the ten-year yield and the XLF put some cold water on that belief. Could it be if interest rates start to fall, as I believe they will (the TNX CLOSED below its 50 day SMA everyday last week), in a perverse fashion it would be bullish for the finnies? Either way i think the banks will start to swim upstream and a couple of my favorite at the moment are regionals. MTB was an outperformer in the group for most of 2022 until it slipped below its sideways channel between the rough 160-185 range recently. I think that was happening for a reason and we will see soon if I am proven correct. But right now my top pick is FRC. The San Francisco based bank started to turn just as the DA in that city was ousted in a recall in early June. The stock is on a 4 week winning streak and has CLOSED above its 50 day SMA for 9 consecutive sessions, which was retested on Wednesday after being underneath the line for all of 2022 prior, and held firm. Over the last 1 month period it has advanced 11%, while the KRE is UNCH.
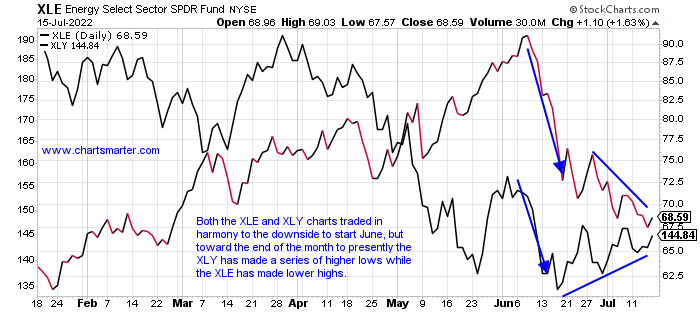
Consumer Discretionary Sector On Watch:
- The struggle has been real for the energy sector as it is the weakest major S&P sector of 11 now on not only a one-week lookback period but a one-month one as well. Last week the XLE slipped 3% and is now lower 5 of the last 6 weeks, beginning with the WEEKLY bearish shooting star at the very round 90 number the week ending 6/10. Give it credit as it attempts to find support at its WEEKLY 50-day SMA with back-to-back productive candlesticks with a hammer last week and a doji candle the week prior (this suggests the selling pressure could be easing). One interesting relationship that caught my eye this weekend was the higher lows the XLY is making, and the XLE doing just the opposite the last 4 weeks. The XLY is still 33% off its most recent 52-week highs, but 3 of the last 4 weeks have CLOSED at or very close to the top of the WEEKLY range, and each of the last 4 has been below the round 140 number intraweek but each CLOSED above the figure. Consider that level to be your line in the sand for knowing you are WRONG.
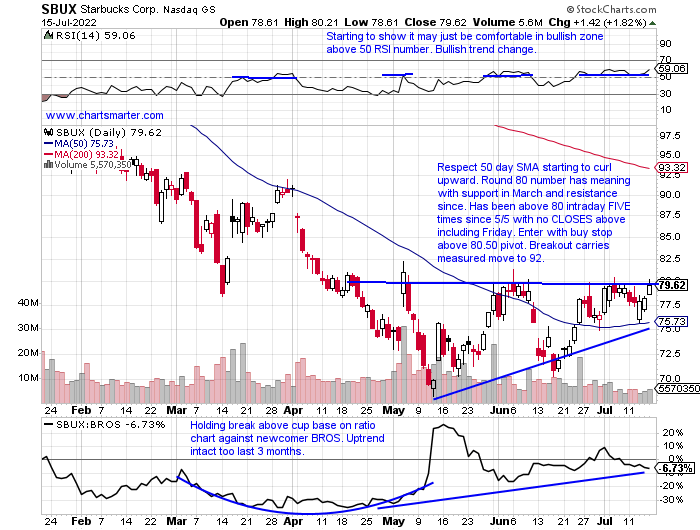
Consumer Name That May Get A Jolt:
- Casual diner play down 32% YTD and 33% over last one-year period. Dividend yield of 2.6%.
- Name 37% off 52-week highs and on 4-week winning streak starting with the week ending 6/24 gain of 8.7%. The last 3 have CLOSED very tautly all within just .36 of each other. Breaks above that type of consolidation can be p0werful.
- Last earnings reaction rose 9.8% on 5/4 but was proceeded by SIX straight negative reactions with the last 4 down 1, 6.3, 2.9, and 3.2% on 2/2, 10/28, 7/28, and 4/28/21.
- Enter with buy stop above bullish ascending triangle.
- Entry SBUX 80.50. Stop 76.
Good luck.
This article requires a Chartsmarter membership. Please click here to join.
Tech Comeback?
- Any chance of a market rebound will need to include technology. As I have been saying for a few weeks now some green shoots are starting. And remember only liars pick bottoms, but some evidence is mounting of a comeback. The Nasdaq is now lower for 12 of the last 15 weeks, so it is still in a firm downtrend that must be respected, but some individual names are offering decent risk/reward with tight stops. AAPL is now back to the 150 number and added more than 2% this week as the Nasdaq slipped 1.6%. It did record a spinning top Friday which suggests it may need some back and filling. MSFT and GOOGL recorded dubious candles however as they were rejected at their 50-day SMAs. Other top holdings in the QQQ like TSLA and AMZN did the same thing. But the ETF did CLOSE at the top of its daily range with NVDA and AVGO helping as the SMH rose almost 3% last week. We are back to familiar resistance as it CLOSED last Friday, and the Friday before right at its 50-day SMA, of course, this time however was a lower high. There is still plenty of work to do but the longer-term WEEKLY chart shows if this 200-day SMA can continue to hold we may look back on this later in the year regretfully for those that did not take advantage.
Round Number Juncture:
- "Old tech" name down 16% YTD and up 13% over the last one-year period. Dividend yield of 3.2%.
- Name 24% off most recent 52-week highs and lower 4 of the last 6 weeks. The last 3 weeks have all CLOSED very taut within just .44 of each other. Nice follow-through Friday after bullish engulfing candle day before.
- Earnings mixed with gains of 3.9 and 10.1% on 6/1 and 11/24/21 and losses of .8 and .6% on 3/1 and 8/27/21.
- Enter after defense of round number/former WEEKLY resistance.
- Entry HPQ here. Stop 28.
Greenback Setback?
- We have heard all the headlines about the US dollar, with the most popular one being it reaching parity with the Euro for the first time in 20 years. As the world around us looks to be falling apart investors still obviously believe in the "king dollar" and its calls for losing its global reserve currency status seem to be more and more wrong with each passing day. This is a blessing for anyone traveling overseas at the moment, but it has been a headwind for equities. On the daily chart below of the greenback, one can see some dubious candlestick between last Tuesday-Friday. If one looks at a WEEKLY chart it just broke above a long cup base at the 104 level that began in March 2020. My feeling is that this uptrend is not over, but it is showing signs of exhaustion. It is about as extended from its rising 50-day SMA as it has been in months and a pullback to that line would be welcoming for the markets.
"Banking" On Gains:
- Earnings season for the group started late last week and Thursday did not get off to the best start. The XLF declined 1.9% on 7/14, but off session lows as it bounced off the round 30 number. That level was influential with plenty of PRICE memory as it was rough resistance the first 3 months of 2018 and then again between November '19-February '20. The ETF then pierced the 30 area to the upside to begin 2021 and here it is back there once again. Will support hold here? Only PRICE knows that and we should get some idea next week. Below is the chart and Friday did complete a bullish island reversal thanks to an unsung hero in C. Most likely shorts were caught off guard as the stock responded very kindly to numbers rising 13%, CLOSING just 2 pennies shy of the very round 50 number. It did also close an upside gap from the 6/9 session. WFC jumped 6% after its own well-received report, and Friday's action put the negative action in JPM and MS Thursday in the rearview mirror. Monday reactions from BAC GS and SCHW should give some further color into the space. The XLF may be saying the worst is behind it.
Yield Dilemma:
- One of the most well-known intermarket relationships was as interest rates rise banks should appreciate. As their net interest margins improve they should stand to benefit. But the chart below looking at the PRICE action of the ten-year yield and the XLF put some cold water on that belief. Could it be if interest rates start to fall, as I believe they will (the TNX CLOSED below its 50 day SMA everyday last week), in a perverse fashion it would be bullish for the finnies? Either way i think the banks will start to swim upstream and a couple of my favorite at the moment are regionals. MTB was an outperformer in the group for most of 2022 until it slipped below its sideways channel between the rough 160-185 range recently. I think that was happening for a reason and we will see soon if I am proven correct. But right now my top pick is FRC. The San Francisco based bank started to turn just as the DA in that city was ousted in a recall in early June. The stock is on a 4 week winning streak and has CLOSED above its 50 day SMA for 9 consecutive sessions, which was retested on Wednesday after being underneath the line for all of 2022 prior, and held firm. Over the last 1 month period it has advanced 11%, while the KRE is UNCH.
Consumer Discretionary Sector On Watch:
- The struggle has been real for the energy sector as it is the weakest major S&P sector of 11 now on not only a one-week lookback period but a one-month one as well. Last week the XLE slipped 3% and is now lower 5 of the last 6 weeks, beginning with the WEEKLY bearish shooting star at the very round 90 number the week ending 6/10. Give it credit as it attempts to find support at its WEEKLY 50-day SMA with back-to-back productive candlesticks with a hammer last week and a doji candle the week prior (this suggests the selling pressure could be easing). One interesting relationship that caught my eye this weekend was the higher lows the XLY is making, and the XLE doing just the opposite the last 4 weeks. The XLY is still 33% off its most recent 52-week highs, but 3 of the last 4 weeks have CLOSED at or very close to the top of the WEEKLY range, and each of the last 4 has been below the round 140 number intraweek but each CLOSED above the figure. Consider that level to be your line in the sand for knowing you are WRONG.
Consumer Name That May Get A Jolt:
- Casual diner play down 32% YTD and 33% over last one-year period. Dividend yield of 2.6%.
- Name 37% off 52-week highs and on 4-week winning streak starting with the week ending 6/24 gain of 8.7%. The last 3 have CLOSED very tautly all within just .36 of each other. Breaks above that type of consolidation can be p0werful.
- Last earnings reaction rose 9.8% on 5/4 but was proceeded by SIX straight negative reactions with the last 4 down 1, 6.3, 2.9, and 3.2% on 2/2, 10/28, 7/28, and 4/28/21.
- Enter with buy stop above bullish ascending triangle.
- Entry SBUX 80.50. Stop 76.
Good luck.