"The Mass Of Men Live Lives Of Quiet Desperation"- Thoreau
Mega-Cap Distinction:
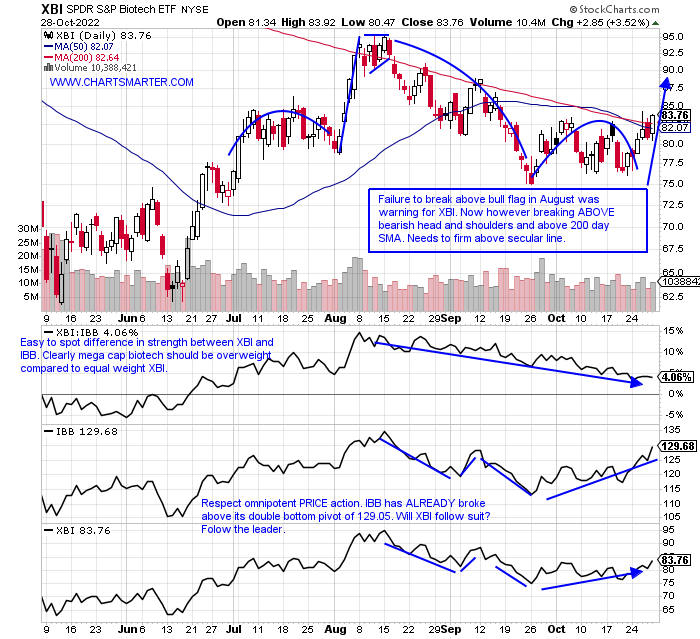
- The above quote could be applied to mega-cap technology bears this past week. Earnings reactions for AMZN META and GOOGL were all ill-received. Now if one peered into the biotech space one would have witnessed quite the opposite. AMGN exploded past resistance on its WEEKLY chart this week taking out a bullish inverse head and shoulders pattern whose trough found support at the very round 200 number in Q4 '21. It was the stock's second 9% gain in the last 3 weeks and look for a move toward 320 into Q1 '23 on the measured move. GILD jumped 17% last week on nearly double the average WEEKLY volume. REGN is bull flagging with the last 7 weeks digesting the 25% WEEKLY gain ending 9/9. Will the XBI follow the IBB's lead? The ratio chart below shows the relative outperformance for the mega-cap names but on an absolute basis, it does not mean the XBI should be avoided. The fund has broken ABOVE a bearish head and shoulders and from FALSE moves tend to come fast ones in the opposite direction. Leading names include NBIX SRPT and HALO.
Ten-Year Angst:
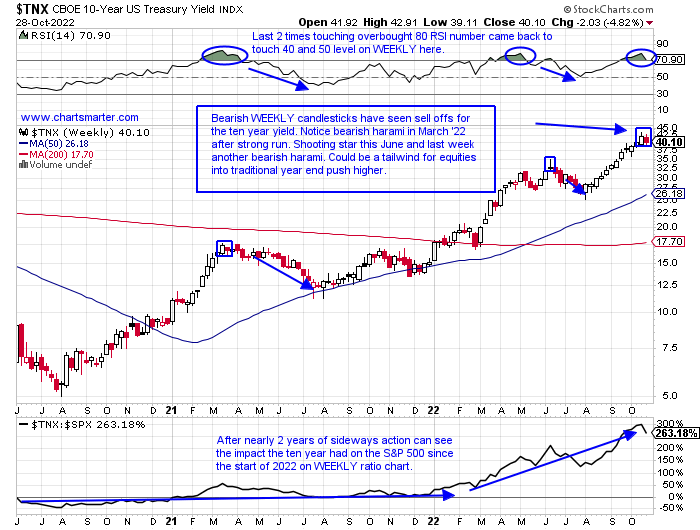
- The ten-year has taken a back seat in media discussion to the two year, but there is some historic action occurring in 2022. This year so far it is down almost 20% and this is easily the largest loss dating back to 1928, only registering one other double-digit decline since then falling 11.1% in 2009. In the last almost 100 years there have been just 12 times the ten-year bond has declined on an annual basis. Seasonality also suggests the bond may firm (yields fall) as October the last 4 years has easily been the best month rising 100% of the time and by nearly an average of 8%. Last week ended a 12-week winning streak and as seen on the chart below bearish candles have precipitated drawdowns of varying degrees. Couple that with the dollar, via the UUP looking toppy (has recorded three bearish engulfing candles in the last 5 weeks making lower highs in the process) and the macro picture is potentially indicating some resilience with equities. Keep in mind the S&P 500 rose almost 4% last week with big cap tech faltering (S&P 500 still 8% on the benchmark had something to do with it). The IWM is up nearly 10% in the last 2 weeks and the Dow Jones is enjoying its rare turn in the spotlight jumped almost 6% last week to record its first 4-week winning streak in almost one year.
Gap Fills Ahead?
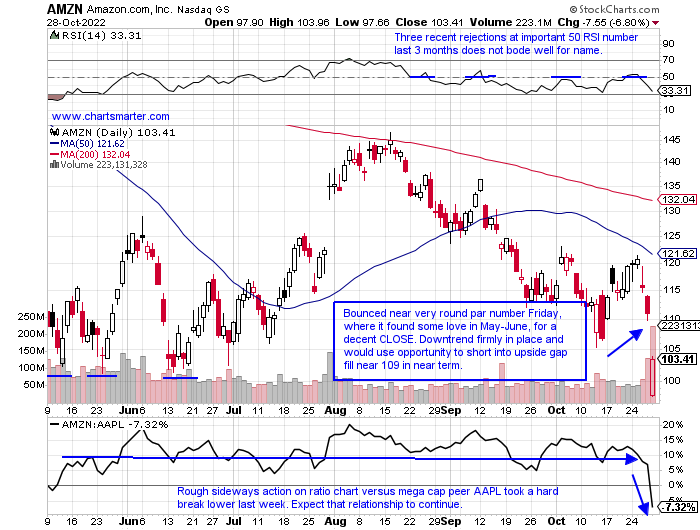
- This past week was always meant to be a volatile one with the bevy of technology behemoths REPORTING earnings. Normally this will create opportunities, not necessarily in the names that were pummeled, but more so in stocks that may have been disproportionately affected in the rubble. However, it does make sense to look at some of the roadkill that was left behind the last several days and try to evaluate what may lie ahead. First, let us give credit where it is due as AAPL was a bastion of strength. The stock rose 8% Friday and was stopped at its 200-day SMA as a double bottom pattern tries to take shape. Give MSFT slight acknowledgment that it recorded its bullish engulfing candle with a higher low from the 10/13 session, something which GOOGL was unable to do. META did record a doji candle Thursday after earnings, which often signals a possible trend change from the prevailing direction. Below is the chart of AMZN and the one I think will have trouble as, and if, it navigates back toward its earnings-related gap fill.
Welcome Back:
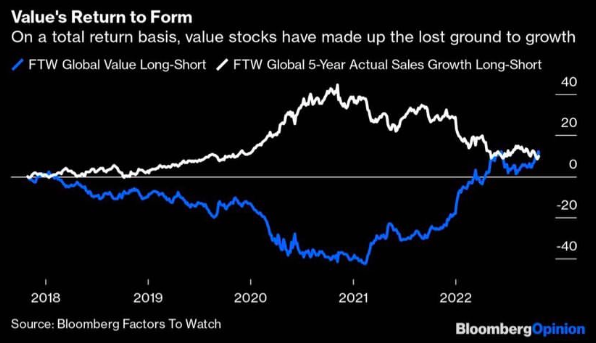
- Good things in life take time, as they do in markets too. The chart below shows how value has now caught up to growth and may be ready to start outperforming in a meaningful way. If one were to look at some of Vanguard's basic value and growth ETFs, the VTV (Value) is just 9% off its most recent 52-week highs and the VUG is off more than 30% from its annual peak made 11 months ago. Another simple way to look at it would be the behavior of the S&P 500 versus the Nasdaq. Now sure the S&P 500 has a 25% weighting in tech, but the Nasdaq has no banking or energy exposure which leaves it "naked". Remember the times past of the incessant chatter with "value versus growth"? I do not either and as long as that remains the case value is likely to top growth. Energy seems extended but likely to continue to shine, banks are brimming and healthcare and staples remain firm. Could homebuilders be the next area that the "value" investors target? Admire how the ITB never undercut its June lows and held the very round 50 number well recently and has been stubborn in not losing contact with its WEEKLY 200-day SMA. DHI is best in breed and now distancing itself from its own 200 day on its daily chart. Above that secular line remain constructive, pun intended.
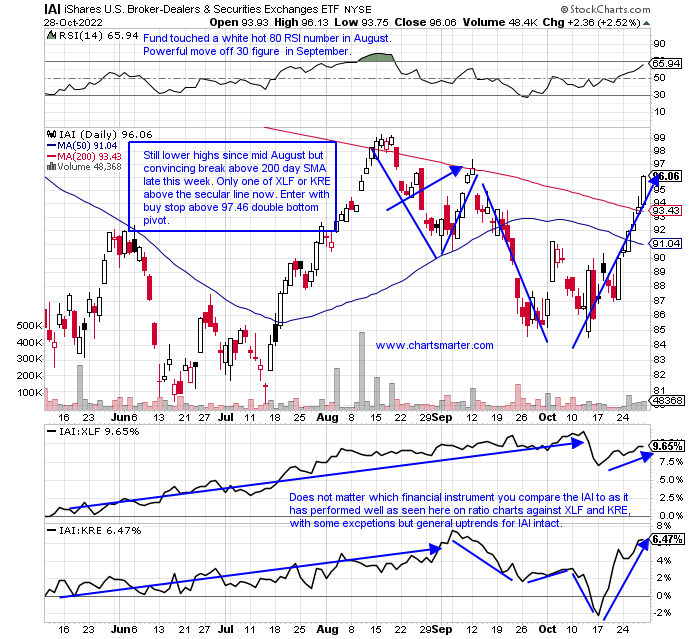
Finnies Swimming Upstream:
- The diverse financial group has an emerging winner as of late, and it is from the broker-dealer space. The IAI is now 17% off its most recent 52-week highs, as the XLF and KRE and 18 and 19% from their annual peaks. It is the only fund of the 3 above its 200-day SMA presently and over the last 3 month period it is edging out peers with a 3% gain (the XLF and KRE over the same time period are up 1% and UNCH respectively and we spoke of their relationship last week). It is quite amusing that the overall space is finding a bid as the expectation of rates is coming down. Inside the illiquid IAI, the top holding in GS looks strong as it is on a 6 session-winning streak and is approaching a double-bottom pivot of 344.47. The fourth largest component within is LPLA which is trading at all-time highs and RJF has screamed higher over its 6-day up streak to the tune of 21%. Both of the last 2 weeks have been accompanied by the largest WEEKLY volume dating back to the 17% advance the week ending 6/5/20. The broker-dealers are doing anything but going broke.
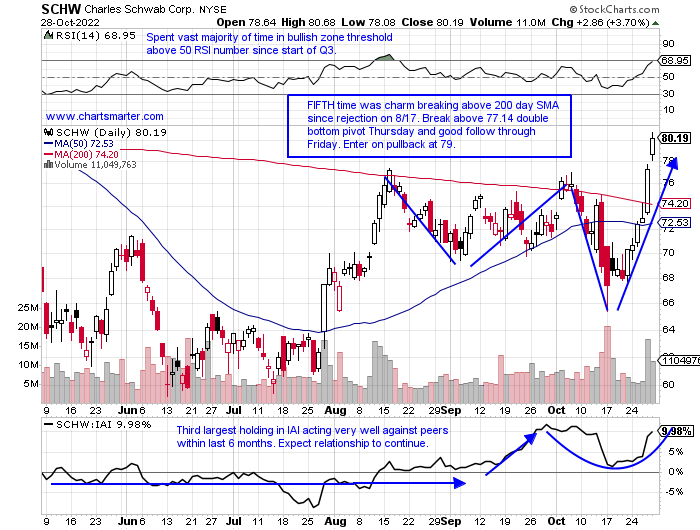
Charles Schwab:
- Investment services play down 5% YTD and 2% over last one year period. Dividend yield of 1.1%.
- Name 17% off most recent 52-week highs and strong 14% gain last week after prior week recorded bullish hammer. First time above WEEKLY 50-day SMA since April now as right side of potential cup base forms.
- FOUR straight negative earnings reactions off 2.2, 1.5, 9.4 and 3.5% on 10/17, 7/18, 4/18 and 1/18.
- Enter on pullback into double bottom breakout.
- Entry SCHW 79. Stop 73.
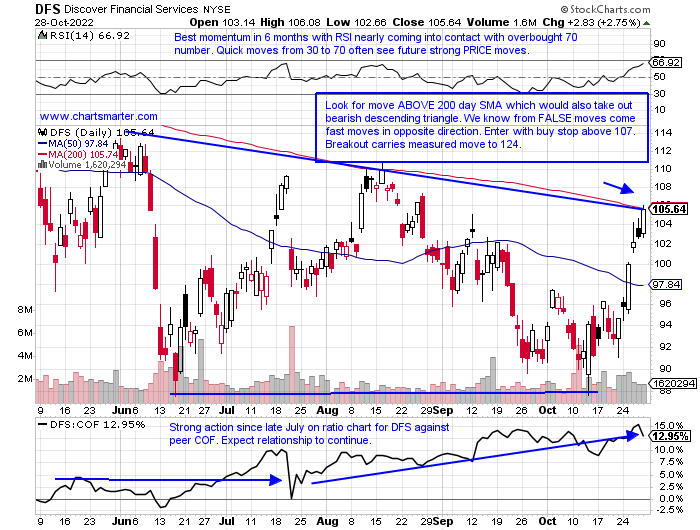
Discover Financial Services:
- Consumer finance play down 9% YTD and 7% over last one year period. Dividend yield of 2.3%.
- Name 19% off most recent 52-week highs and best WEEKLY gain in almost 2 years up 11.6%. Recorded huge run of almost 500% from lows of March '20-August '21. Nice double bottom just below 90 from June and October.
- Earnings mixed up 4.3 and 8.4% on 10/25 and 4/28 and losses of 8.9 and 1.4% on 7/21 and 1/20.
- Enter with buy stop ABOVE bearish descending triangle/200-day SMA.
- Entry DFS 107. Stop 102.
Good luck.
This article requires a Chartsmarter membership. Please click here to join.
"The Mass Of Men Live Lives Of Quiet Desperation"- Thoreau
Mega-Cap Distinction:
- The above quote could be applied to mega-cap technology bears this past week. Earnings reactions for AMZN META and GOOGL were all ill-received. Now if one peered into the biotech space one would have witnessed quite the opposite. AMGN exploded past resistance on its WEEKLY chart this week taking out a bullish inverse head and shoulders pattern whose trough found support at the very round 200 number in Q4 '21. It was the stock's second 9% gain in the last 3 weeks and look for a move toward 320 into Q1 '23 on the measured move. GILD jumped 17% last week on nearly double the average WEEKLY volume. REGN is bull flagging with the last 7 weeks digesting the 25% WEEKLY gain ending 9/9. Will the XBI follow the IBB's lead? The ratio chart below shows the relative outperformance for the mega-cap names but on an absolute basis, it does not mean the XBI should be avoided. The fund has broken ABOVE a bearish head and shoulders and from FALSE moves tend to come fast ones in the opposite direction. Leading names include NBIX SRPT and HALO.
Ten-Year Angst:
- The ten-year has taken a back seat in media discussion to the two year, but there is some historic action occurring in 2022. This year so far it is down almost 20% and this is easily the largest loss dating back to 1928, only registering one other double-digit decline since then falling 11.1% in 2009. In the last almost 100 years there have been just 12 times the ten-year bond has declined on an annual basis. Seasonality also suggests the bond may firm (yields fall) as October the last 4 years has easily been the best month rising 100% of the time and by nearly an average of 8%. Last week ended a 12-week winning streak and as seen on the chart below bearish candles have precipitated drawdowns of varying degrees. Couple that with the dollar, via the UUP looking toppy (has recorded three bearish engulfing candles in the last 5 weeks making lower highs in the process) and the macro picture is potentially indicating some resilience with equities. Keep in mind the S&P 500 rose almost 4% last week with big cap tech faltering (S&P 500 still 8% on the benchmark had something to do with it). The IWM is up nearly 10% in the last 2 weeks and the Dow Jones is enjoying its rare turn in the spotlight jumped almost 6% last week to record its first 4-week winning streak in almost one year.
Gap Fills Ahead?
- This past week was always meant to be a volatile one with the bevy of technology behemoths REPORTING earnings. Normally this will create opportunities, not necessarily in the names that were pummeled, but more so in stocks that may have been disproportionately affected in the rubble. However, it does make sense to look at some of the roadkill that was left behind the last several days and try to evaluate what may lie ahead. First, let us give credit where it is due as AAPL was a bastion of strength. The stock rose 8% Friday and was stopped at its 200-day SMA as a double bottom pattern tries to take shape. Give MSFT slight acknowledgment that it recorded its bullish engulfing candle with a higher low from the 10/13 session, something which GOOGL was unable to do. META did record a doji candle Thursday after earnings, which often signals a possible trend change from the prevailing direction. Below is the chart of AMZN and the one I think will have trouble as, and if, it navigates back toward its earnings-related gap fill.
Welcome Back:
- Good things in life take time, as they do in markets too. The chart below shows how value has now caught up to growth and may be ready to start outperforming in a meaningful way. If one were to look at some of Vanguard's basic value and growth ETFs, the VTV (Value) is just 9% off its most recent 52-week highs and the VUG is off more than 30% from its annual peak made 11 months ago. Another simple way to look at it would be the behavior of the S&P 500 versus the Nasdaq. Now sure the S&P 500 has a 25% weighting in tech, but the Nasdaq has no banking or energy exposure which leaves it "naked". Remember the times past of the incessant chatter with "value versus growth"? I do not either and as long as that remains the case value is likely to top growth. Energy seems extended but likely to continue to shine, banks are brimming and healthcare and staples remain firm. Could homebuilders be the next area that the "value" investors target? Admire how the ITB never undercut its June lows and held the very round 50 number well recently and has been stubborn in not losing contact with its WEEKLY 200-day SMA. DHI is best in breed and now distancing itself from its own 200 day on its daily chart. Above that secular line remain constructive, pun intended.
Finnies Swimming Upstream:
- The diverse financial group has an emerging winner as of late, and it is from the broker-dealer space. The IAI is now 17% off its most recent 52-week highs, as the XLF and KRE and 18 and 19% from their annual peaks. It is the only fund of the 3 above its 200-day SMA presently and over the last 3 month period it is edging out peers with a 3% gain (the XLF and KRE over the same time period are up 1% and UNCH respectively and we spoke of their relationship last week). It is quite amusing that the overall space is finding a bid as the expectation of rates is coming down. Inside the illiquid IAI, the top holding in GS looks strong as it is on a 6 session-winning streak and is approaching a double-bottom pivot of 344.47. The fourth largest component within is LPLA which is trading at all-time highs and RJF has screamed higher over its 6-day up streak to the tune of 21%. Both of the last 2 weeks have been accompanied by the largest WEEKLY volume dating back to the 17% advance the week ending 6/5/20. The broker-dealers are doing anything but going broke.
Charles Schwab:
- Investment services play down 5% YTD and 2% over last one year period. Dividend yield of 1.1%.
- Name 17% off most recent 52-week highs and strong 14% gain last week after prior week recorded bullish hammer. First time above WEEKLY 50-day SMA since April now as right side of potential cup base forms.
- FOUR straight negative earnings reactions off 2.2, 1.5, 9.4 and 3.5% on 10/17, 7/18, 4/18 and 1/18.
- Enter on pullback into double bottom breakout.
- Entry SCHW 79. Stop 73.
Discover Financial Services:
- Consumer finance play down 9% YTD and 7% over last one year period. Dividend yield of 2.3%.
- Name 19% off most recent 52-week highs and best WEEKLY gain in almost 2 years up 11.6%. Recorded huge run of almost 500% from lows of March '20-August '21. Nice double bottom just below 90 from June and October.
- Earnings mixed up 4.3 and 8.4% on 10/25 and 4/28 and losses of 8.9 and 1.4% on 7/21 and 1/20.
- Enter with buy stop ABOVE bearish descending triangle/200-day SMA.
- Entry DFS 107. Stop 102.
Good luck.