"It usually takes more than 3 weeks to prepare a good impromptu speech." Mark Twain
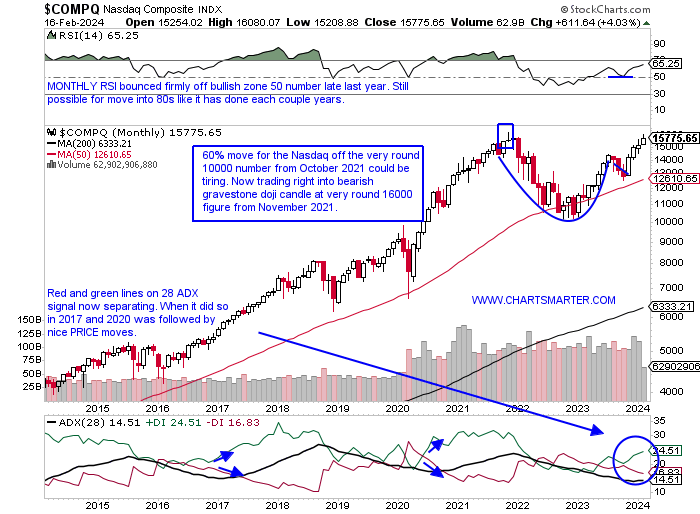
Nasdaq Brick Wall?
- In our last WEEK AHEAD Note we opened with the quote "Whenever you find yourself on the side of the majority, it is time to pause and reflect." To be frank many market participants were very hyper-bullish given the big tech move in November-December last year, however, January failed to deliver on the "Santa Claus rally" and the January barometer as well with the Nasdaq up 1% (much different to January 2023 that jumped almost 10%). It feels like the benchmark is at a stalemate here as sentiment has become negative. With seasonality bearish and the Nasdaq coming into contact with the round 16000 figure (on 2/9-12 both CLOSED below though), last touched with the MONTHLY bearish gravestone candle in late 2021 is a double top on hand? The vast majority of smart investors I communicate with are bearish now, myself included, and the daily chart seems to confirm this belief. We are seeing negative RSI divergence, with PRICE beginning to confirm, with dubious candlesticks too with a shooting star and engulfing candle on Monday and Friday. I think one should be positioned with plenty of cash, but be open to the idea of another leg higher. One can always get back in with a firm break above 16000. Patience here, with no need to be a hero.
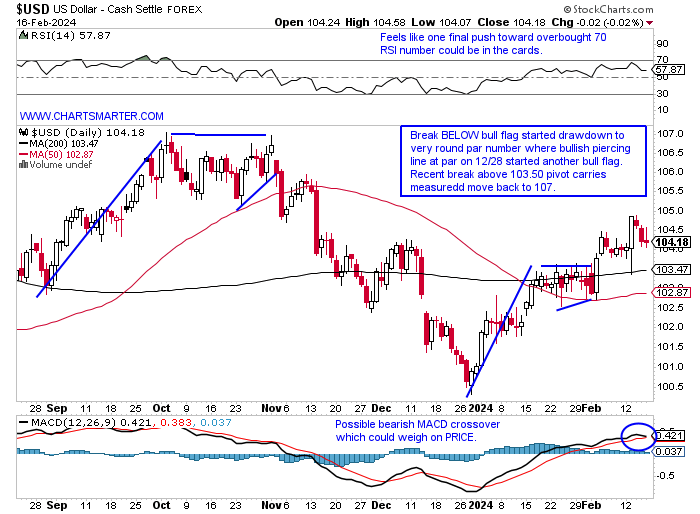
Dollar Dilemma:
- Round number theory has worked very well regarding the greenback. It has begun 2024 on a strong note now on a 7-week win streak, although there have been some WEEKLY candles to suggest that run may be tiring. Three of the last 4 weeks have recorded a shooting star and two spinning tops. Over the last year, one can see how the dollar has enjoyed some spirited runs only to fall back in the direction of the downturn that started in Q4 '22. Overall it has the look of a double bottom at par from last summer and the current move and perhaps could be building the right side of a lone cup base. With the daily chart below I think this moves toward 107 in the near term which could weigh on equities. We have spoken about this before but the relationship between the S&P 500 and the dollar has been correlated since the start of 2024 and neither has blinked yet. It has not affected oil yet either as the two trade hand in hand as well over the last 6 months, contrary to historical relationships. In fact, a move above 80 on WTI could see a measured move to 92 which should make things interesting as election season will heat up into the summer.
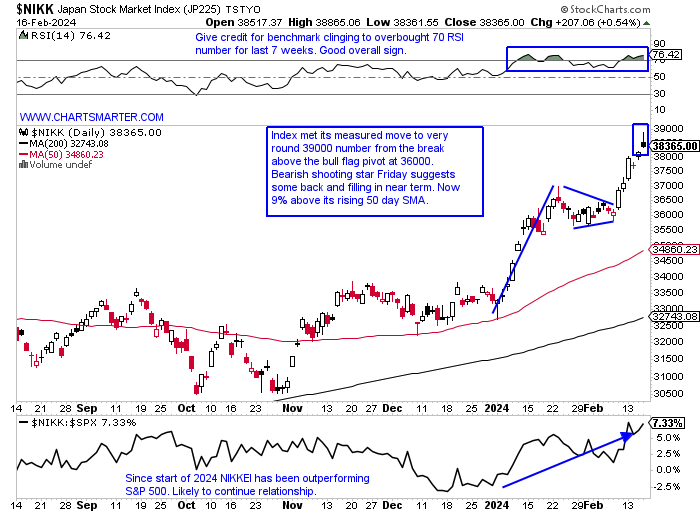
Round Number Contention:
- Long-time readers of mine are aware of my affinity for round number theory, meaning that instruments tend to pause or bounce off these levels. Of course, the Nasdaq at 16000, the S&P 500 at 5000, and the Russell 2000 fighting to stay above 2000. Below is the chart of the Nikkei and it too is not immune. Time will tell but the reversal Friday within a sniff of the 39000 level, could see some weakness in the near term. We liked this chart last December, and we still do but may be time for a little trimming. When looking at best-of-breed names the buck stops at TM and here one can see the big break above a MONTHLY cup base pattern more than 2 years long. It continues to dominate regional auto peer HMC, doubling its YTD gain up 24%, and nearly tripling it over the last 3 months up 18% while Honda has added 7%. Looking at international bank stocks Japan is not disappointing. The chart of MUFG just broke above a long cup base pivot of 9.14 and it has strong potential of ridding itself of single-digit status shortly. Do not discount European banks either with BBVA now buyable here as it retests a double bottom breakout pivot of 9.53, after not surprisingly being rejected precisely at the very round 10 number Monday.
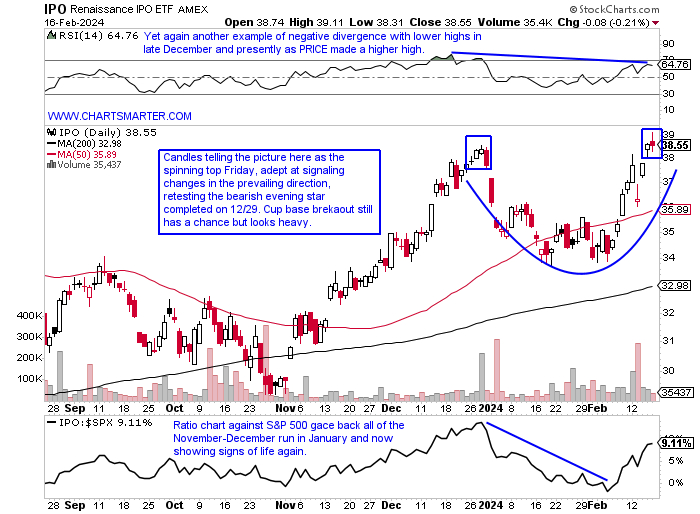
New Issue Issues?
- At market inflection points, like the present, we like to gauge market sentiment for clues about possible market direction. In the recent past, we took a peek at the bull flag on the JNK, which is no longer working (the flag is still there but getting long in the tooth and recorded doji candles last Tuesday and Friday). The FFTY, an IBD fund that contains leading stocks, has come to life although it is well off all-time highs and last week registered a bearish harami cross after a 35% run from the very round 20 number last October (notice it did shrug one off in December). Below is the chart of another illiquid ETF in IPO, but these give a good representation of how the underlying constituents are doing and it too could be dealing with a double top here. The saying goes "There is nothing more bearish than a bullish setup that fails" and if this cup base breakout unravels here that would be a big red flag. One chart that has my interest is CART, although I am conflicted as it did absolutely nothing from the late October lows as others soared. But bears have been unable to push this lower and a bullish inverse head and shoulders pattern has formed. A CLOSE above 28 would carry a measured move to 34. Admire how the 21-day EMA once resistance now looks like support.
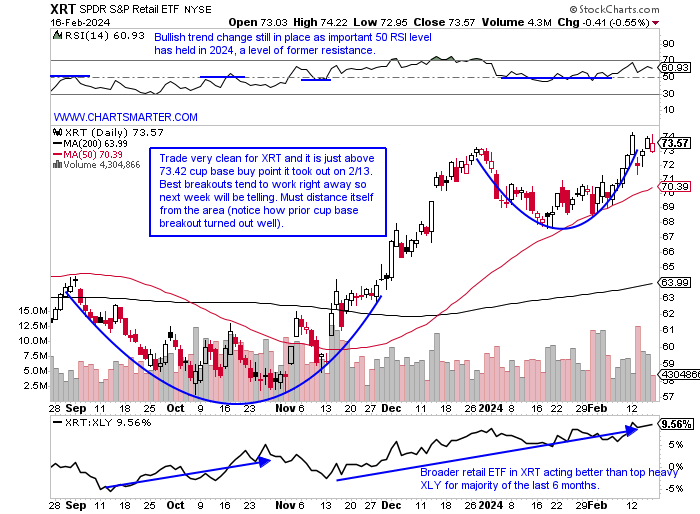
Retail Woes:
- There is plenty of chatter about how well the consumer is positioned, and on the flip side, one hears about how their debt levels are rising too. As technicians, we believe the real story is how PRICE action is behaving. Which discretionary ETF is painting the picture in a better way? To me, it is the broader XRT and one can see that on the ratio chart below over the last 6 months. Looking at the returns of each over the last 3 months the XRT doubles the gain of the XLY higher by more than 16%. Now one may say that is simply a function of the drawdown in TSLA, (we spoke about that here recently) the second largest holding in the ETF (AMZN now makes up more than one-quarter of the XLY). Concerning AMZN the pausing after a bull flag breakout and the bearish dark cloud cover candle on 2/12 suggests an earnings gap fill from the 2/1 session may be on the table. The WEEKLY chart of the XRT sports a long bullish ascending triangle and a break above 75 would carry a measured move to near par where it last touched in late 2021 and negate the bearish evening star pattern from the first week of 2024 (and a doji from the last week of 2023). Let us take a look at a couple of names in the overall discretionary space.
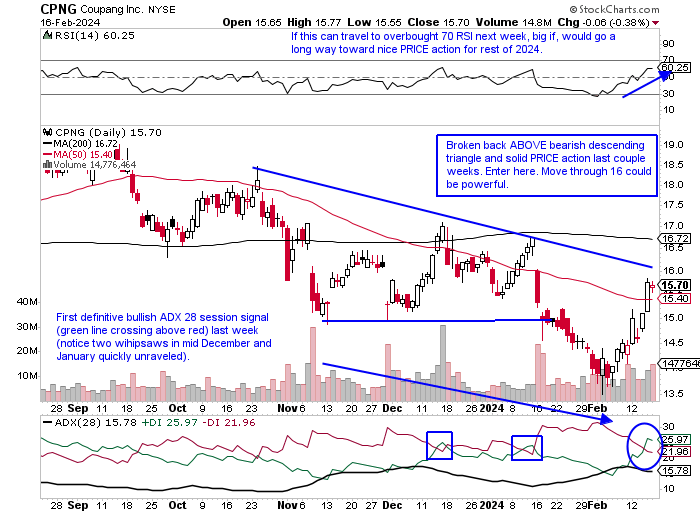
Coupang:
- E-commerce play down 3% YTD and 3% over the last one-year period.
- Name 21% off most recent 52-week highs and WEEKLY chart shows a nice CLOSE at top of WEEKLY range and good relative strength up 8.5%. The prior two weeks were bullish hammers that successfully retested bullish morning star completed the week ending 3/24/23 before a nice move to the very round 20 number.
- Earnings reactions mostly lower off 9.9, 4.5, and 5.4% on 11/8, 5/10, and 3/1/23 and rose 7.9% on 8/9/23.
- Enter after strong ADX signal/break back above descending triangle pattern.
- Entry CPNG here. Stop 15 (REPORTS 2/27 after close).
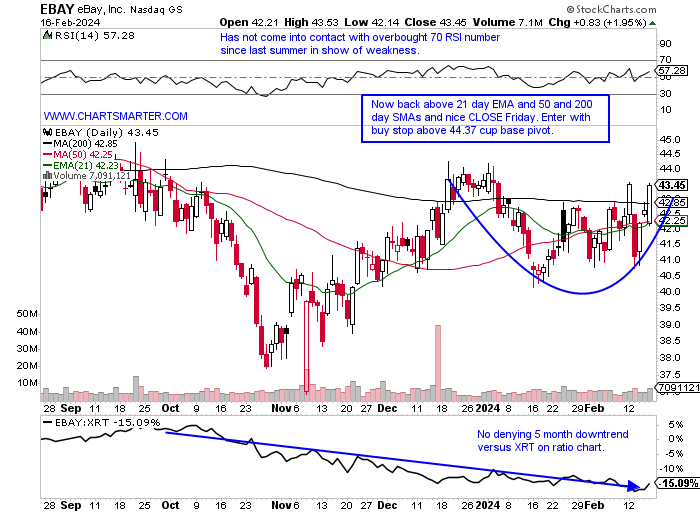
Ebay:
- Consumer services play UNCH YTD and down 11% over last one year period. Dividend yield of 2.3%.
- Name 12% off most recent 52-week highs and like CPNG, CLOSED at highs for WEEKLY range and displayed good relative strength up 2.4% doubling gain of XRT. Last 5 weeks have also CLOSED at highs of WEEKLY range as well and last weeks bullish hammer CLOSED above 50 WEEK SMA.
- Earnings reactions mostly lower off 2, 10.5, and 5.2% on 11/8, 7/27 and 2/23 and rose 5.1% on 4/27.
- Enter with buy stop above cup base.
- Entry EBAY 44.37. Stop 41.75 (REPORTS 2/27 after close).
This article requires a Chartsmarter membership. Please click here to join.
"It usually takes more than 3 weeks to prepare a good impromptu speech." Mark Twain
Nasdaq Brick Wall?
- In our last WEEK AHEAD Note we opened with the quote "Whenever you find yourself on the side of the majority, it is time to pause and reflect." To be frank many market participants were very hyper-bullish given the big tech move in November-December last year, however, January failed to deliver on the "Santa Claus rally" and the January barometer as well with the Nasdaq up 1% (much different to January 2023 that jumped almost 10%). It feels like the benchmark is at a stalemate here as sentiment has become negative. With seasonality bearish and the Nasdaq coming into contact with the round 16000 figure (on 2/9-12 both CLOSED below though), last touched with the MONTHLY bearish gravestone candle in late 2021 is a double top on hand? The vast majority of smart investors I communicate with are bearish now, myself included, and the daily chart seems to confirm this belief. We are seeing negative RSI divergence, with PRICE beginning to confirm, with dubious candlesticks too with a shooting star and engulfing candle on Monday and Friday. I think one should be positioned with plenty of cash, but be open to the idea of another leg higher. One can always get back in with a firm break above 16000. Patience here, with no need to be a hero.
Dollar Dilemma:
- Round number theory has worked very well regarding the greenback. It has begun 2024 on a strong note now on a 7-week win streak, although there have been some WEEKLY candles to suggest that run may be tiring. Three of the last 4 weeks have recorded a shooting star and two spinning tops. Over the last year, one can see how the dollar has enjoyed some spirited runs only to fall back in the direction of the downturn that started in Q4 '22. Overall it has the look of a double bottom at par from last summer and the current move and perhaps could be building the right side of a lone cup base. With the daily chart below I think this moves toward 107 in the near term which could weigh on equities. We have spoken about this before but the relationship between the S&P 500 and the dollar has been correlated since the start of 2024 and neither has blinked yet. It has not affected oil yet either as the two trade hand in hand as well over the last 6 months, contrary to historical relationships. In fact, a move above 80 on WTI could see a measured move to 92 which should make things interesting as election season will heat up into the summer.
Round Number Contention:
- Long-time readers of mine are aware of my affinity for round number theory, meaning that instruments tend to pause or bounce off these levels. Of course, the Nasdaq at 16000, the S&P 500 at 5000, and the Russell 2000 fighting to stay above 2000. Below is the chart of the Nikkei and it too is not immune. Time will tell but the reversal Friday within a sniff of the 39000 level, could see some weakness in the near term. We liked this chart last December, and we still do but may be time for a little trimming. When looking at best-of-breed names the buck stops at TM and here one can see the big break above a MONTHLY cup base pattern more than 2 years long. It continues to dominate regional auto peer HMC, doubling its YTD gain up 24%, and nearly tripling it over the last 3 months up 18% while Honda has added 7%. Looking at international bank stocks Japan is not disappointing. The chart of MUFG just broke above a long cup base pivot of 9.14 and it has strong potential of ridding itself of single-digit status shortly. Do not discount European banks either with BBVA now buyable here as it retests a double bottom breakout pivot of 9.53, after not surprisingly being rejected precisely at the very round 10 number Monday.
New Issue Issues?
- At market inflection points, like the present, we like to gauge market sentiment for clues about possible market direction. In the recent past, we took a peek at the bull flag on the JNK, which is no longer working (the flag is still there but getting long in the tooth and recorded doji candles last Tuesday and Friday). The FFTY, an IBD fund that contains leading stocks, has come to life although it is well off all-time highs and last week registered a bearish harami cross after a 35% run from the very round 20 number last October (notice it did shrug one off in December). Below is the chart of another illiquid ETF in IPO, but these give a good representation of how the underlying constituents are doing and it too could be dealing with a double top here. The saying goes "There is nothing more bearish than a bullish setup that fails" and if this cup base breakout unravels here that would be a big red flag. One chart that has my interest is CART, although I am conflicted as it did absolutely nothing from the late October lows as others soared. But bears have been unable to push this lower and a bullish inverse head and shoulders pattern has formed. A CLOSE above 28 would carry a measured move to 34. Admire how the 21-day EMA once resistance now looks like support.
Retail Woes:
- There is plenty of chatter about how well the consumer is positioned, and on the flip side, one hears about how their debt levels are rising too. As technicians, we believe the real story is how PRICE action is behaving. Which discretionary ETF is painting the picture in a better way? To me, it is the broader XRT and one can see that on the ratio chart below over the last 6 months. Looking at the returns of each over the last 3 months the XRT doubles the gain of the XLY higher by more than 16%. Now one may say that is simply a function of the drawdown in TSLA, (we spoke about that here recently) the second largest holding in the ETF (AMZN now makes up more than one-quarter of the XLY). Concerning AMZN the pausing after a bull flag breakout and the bearish dark cloud cover candle on 2/12 suggests an earnings gap fill from the 2/1 session may be on the table. The WEEKLY chart of the XRT sports a long bullish ascending triangle and a break above 75 would carry a measured move to near par where it last touched in late 2021 and negate the bearish evening star pattern from the first week of 2024 (and a doji from the last week of 2023). Let us take a look at a couple of names in the overall discretionary space.
Coupang:
- E-commerce play down 3% YTD and 3% over the last one-year period.
- Name 21% off most recent 52-week highs and WEEKLY chart shows a nice CLOSE at top of WEEKLY range and good relative strength up 8.5%. The prior two weeks were bullish hammers that successfully retested bullish morning star completed the week ending 3/24/23 before a nice move to the very round 20 number.
- Earnings reactions mostly lower off 9.9, 4.5, and 5.4% on 11/8, 5/10, and 3/1/23 and rose 7.9% on 8/9/23.
- Enter after strong ADX signal/break back above descending triangle pattern.
- Entry CPNG here. Stop 15 (REPORTS 2/27 after close).
Ebay:
- Consumer services play UNCH YTD and down 11% over last one year period. Dividend yield of 2.3%.
- Name 12% off most recent 52-week highs and like CPNG, CLOSED at highs for WEEKLY range and displayed good relative strength up 2.4% doubling gain of XRT. Last 5 weeks have also CLOSED at highs of WEEKLY range as well and last weeks bullish hammer CLOSED above 50 WEEK SMA.
- Earnings reactions mostly lower off 2, 10.5, and 5.2% on 11/8, 7/27 and 2/23 and rose 5.1% on 4/27.
- Enter with buy stop above cup base.
- Entry EBAY 44.37. Stop 41.75 (REPORTS 2/27 after close).