Growth In Vogue:
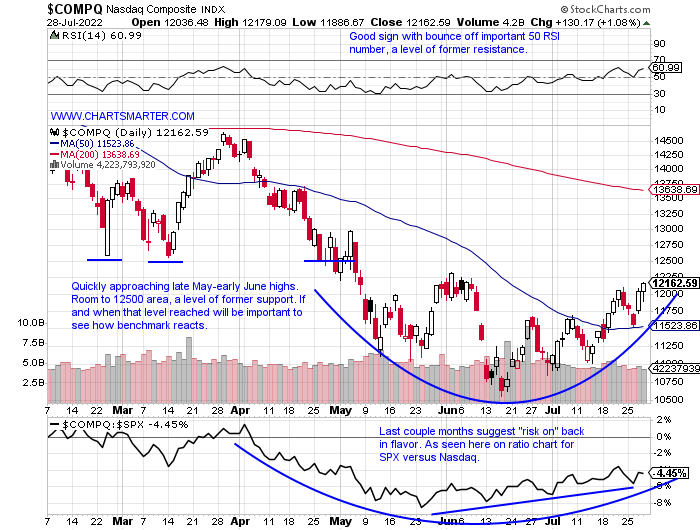
- On a day when technology acted well with the XLK up 1.4%, it was "only" the seventh best major S&P sector performer. Both the XLU and XLRE shined Thursday with advances of more than 3%. And tech was aided by an uncommon source via the renewable energy equipment space. The TAN ETF rose 7% Thursday and that was on top of the 6% advance on Wednesday. For the week with one session left the fund is up by 14%. On its WEEKLY chart, it broke through resistance at the round 80 number and now looks poised to travel toward the very round par number into the latter half of 2022 which would be a double bottom base with a pivot of 101.68. But do not sleep on the semis and software as the SMH is likely to extend its winning streak to 4 up almost 4% heading into Friday. The IGV is higher by nearly 2% as it approaches the round 300 number which has been both support and resistance in 2022 thus far. Of course, AAPL will have a big say in how the week ends tomorrow and it CLOSED just 1% from its 200-day SMA. Put your seat belts on for tomorrow. AMZN ROKU KLAC and INTC round out the festivities.

Software On Sale?
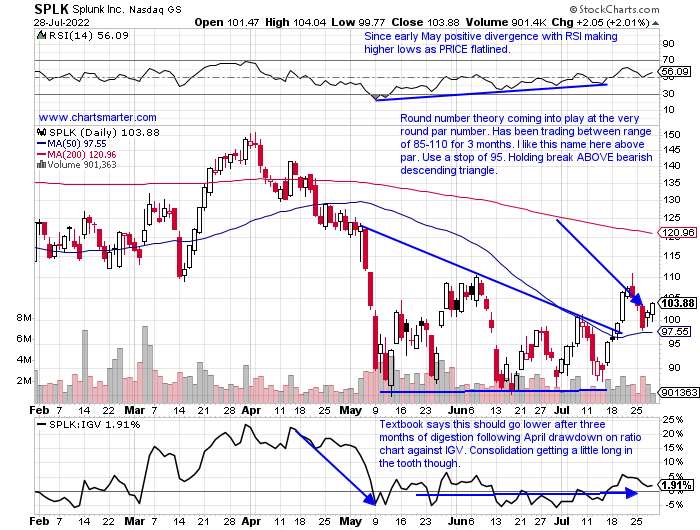
- I often like to see which of the two powerful groups within technology is in play. In other words which one is acting better, and therefore should one be overweight? Comparing the semiconductors to software on a YTD basis the returns are similar but we are starting to see some divergence in the shorter time frame periods. On a one month look back period the SMH is higher by 12% almost double that of the IGV, and on a 3-month period, the SMH has declined "just" 2%, whereas the IGV has dropped 6%. That being said there will be standouts or outliers in each of these subsectors. Below is the chart of one in software that I feel presents a good risk/reward situation. SPLK is holding the very round par number well and Wednesday recorded a bullish harami candle there which doubled as rising 50-day SMA support. It has produced three consecutive positive earnings reactions of 9.5, 6, and 4.7% on 5/26, 3/3 and 12/2/21 after the prior 5 before that all fell. The stock has been mentioned as a possible takeover target, and one should never base their decisions on that alone, but PRICE alone looks attractive.

Recent Examples:
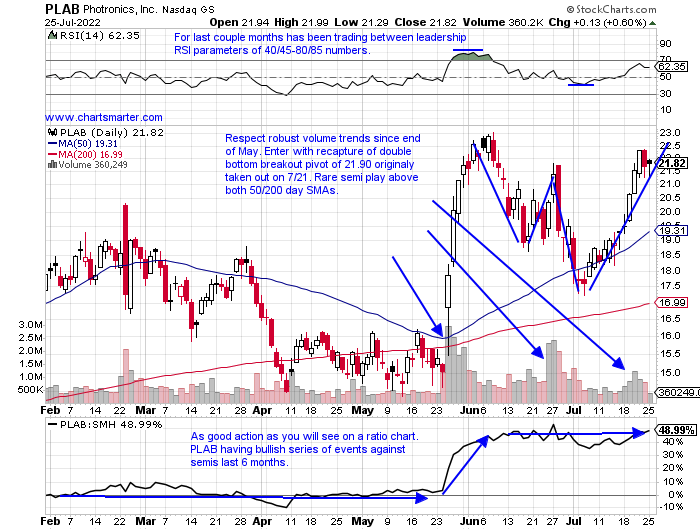
- The semiconductor group is the dominant group within technology and we have seen some interesting moves as of late. QCOM on Thursday fell more than 4.6% after an ill-received earnings reaction. LRCX rose 3.7% and reversed more than 30 handles off intra-session lows which found support at its 50-day SMA. PI rose 19% after a well-received earnings report Thursday and this one had been showing strength beforehand as it had advanced 7 of the last 9 weeks. That kind of strength reminds me of the chart below of PLAB and how it appeared in our 7/26 Technology Note. This name is up 7% heading into Friday and looks likely to record a 4-week winning streak, and this is after a nearly 40% WEEKLY gain the week ending 5/27. It reclaimed it's 21.90 double bottom breakout pivot on Wednesday and look for this name to grind higher as it was one that showed strength early on when most were fragile.

Special Situations:
- Semi play lower by 39% YTD and 8% over last one year period. Dividend yield of .1%.
- Name 48% off most recent 52-week highs and last week demonstrated good relative strength up 9.9% as the SMH added 5.6%. Attempting to advance in back-to-back weeks Friday for just the second time since last November.
- Earnings mostly higher up 5.2, 8.2, and 4% on 5/26, 11/18, and 8/19/21 (fell 7.6% on 2/17).
- Enter with buy stop above bull flag pivot.
- Entry NVDA 181. Stop 168.

- Big Blue lower by 3% YTD and 4% over last one-year period. Dividend yield of 5.1%.
- Name 12% off most recent 52-week highs and on current 4-week losing streak. Not doing much this week up .7% heading into Friday after the prior week slumped 8.3%.
- Earnings mixed with gains of 7.1 and 5.6% on 4/20 and 1/25 and losses of 5.2 and 9.6% on 7/19 and 10/21/21.
- Enter at 200 day SMA.
- Entry IBM 128. Stop 125.

- Social media giant down 52% YTD and 57% over last one year period.
- Name 58% off most recent 52 week highs and this week off 5% heading into Friday. Bullish WEEKLY hammer candle week ending 6/24 and engulfing week ending 7/8 rose and 3.9 and 6.8% respectively.
- Earnings mostly lower off 5.6, 26.4 and 3.9% on 7/28, 2/3 and 10/26/21 (rose 17.6% on 4/28).
- Enter on pullback into bullish hammer candle.
- Entry META 159. Stop 154.

Good luck.
Entry summaries:
Buy stop above bull flag pivot NVDA 181. Stop 168.
Buy at 200 day SMA IBM 128. Stop 125.
Buy pullback into bullish hammer candle META 159. Stop 154.
This article requires a Chartsmarter membership. Please click here to join.
Growth In Vogue:
- On a day when technology acted well with the XLK up 1.4%, it was "only" the seventh best major S&P sector performer. Both the XLU and XLRE shined Thursday with advances of more than 3%. And tech was aided by an uncommon source via the renewable energy equipment space. The TAN ETF rose 7% Thursday and that was on top of the 6% advance on Wednesday. For the week with one session left the fund is up by 14%. On its WEEKLY chart, it broke through resistance at the round 80 number and now looks poised to travel toward the very round par number into the latter half of 2022 which would be a double bottom base with a pivot of 101.68. But do not sleep on the semis and software as the SMH is likely to extend its winning streak to 4 up almost 4% heading into Friday. The IGV is higher by nearly 2% as it approaches the round 300 number which has been both support and resistance in 2022 thus far. Of course, AAPL will have a big say in how the week ends tomorrow and it CLOSED just 1% from its 200-day SMA. Put your seat belts on for tomorrow. AMZN ROKU KLAC and INTC round out the festivities.

Software On Sale?
- I often like to see which of the two powerful groups within technology is in play. In other words which one is acting better, and therefore should one be overweight? Comparing the semiconductors to software on a YTD basis the returns are similar but we are starting to see some divergence in the shorter time frame periods. On a one month look back period the SMH is higher by 12% almost double that of the IGV, and on a 3-month period, the SMH has declined "just" 2%, whereas the IGV has dropped 6%. That being said there will be standouts or outliers in each of these subsectors. Below is the chart of one in software that I feel presents a good risk/reward situation. SPLK is holding the very round par number well and Wednesday recorded a bullish harami candle there which doubled as rising 50-day SMA support. It has produced three consecutive positive earnings reactions of 9.5, 6, and 4.7% on 5/26, 3/3 and 12/2/21 after the prior 5 before that all fell. The stock has been mentioned as a possible takeover target, and one should never base their decisions on that alone, but PRICE alone looks attractive.

Recent Examples:
- The semiconductor group is the dominant group within technology and we have seen some interesting moves as of late. QCOM on Thursday fell more than 4.6% after an ill-received earnings reaction. LRCX rose 3.7% and reversed more than 30 handles off intra-session lows which found support at its 50-day SMA. PI rose 19% after a well-received earnings report Thursday and this one had been showing strength beforehand as it had advanced 7 of the last 9 weeks. That kind of strength reminds me of the chart below of PLAB and how it appeared in our 7/26 Technology Note. This name is up 7% heading into Friday and looks likely to record a 4-week winning streak, and this is after a nearly 40% WEEKLY gain the week ending 5/27. It reclaimed it's 21.90 double bottom breakout pivot on Wednesday and look for this name to grind higher as it was one that showed strength early on when most were fragile.

Special Situations:
- Semi play lower by 39% YTD and 8% over last one year period. Dividend yield of .1%.
- Name 48% off most recent 52-week highs and last week demonstrated good relative strength up 9.9% as the SMH added 5.6%. Attempting to advance in back-to-back weeks Friday for just the second time since last November.
- Earnings mostly higher up 5.2, 8.2, and 4% on 5/26, 11/18, and 8/19/21 (fell 7.6% on 2/17).
- Enter with buy stop above bull flag pivot.
- Entry NVDA 181. Stop 168.

- Big Blue lower by 3% YTD and 4% over last one-year period. Dividend yield of 5.1%.
- Name 12% off most recent 52-week highs and on current 4-week losing streak. Not doing much this week up .7% heading into Friday after the prior week slumped 8.3%.
- Earnings mixed with gains of 7.1 and 5.6% on 4/20 and 1/25 and losses of 5.2 and 9.6% on 7/19 and 10/21/21.
- Enter at 200 day SMA.
- Entry IBM 128. Stop 125.

- Social media giant down 52% YTD and 57% over last one year period.
- Name 58% off most recent 52 week highs and this week off 5% heading into Friday. Bullish WEEKLY hammer candle week ending 6/24 and engulfing week ending 7/8 rose and 3.9 and 6.8% respectively.
- Earnings mostly lower off 5.6, 26.4 and 3.9% on 7/28, 2/3 and 10/26/21 (rose 17.6% on 4/28).
- Enter on pullback into bullish hammer candle.
- Entry META 159. Stop 154.

Good luck.
Entry summaries:
Buy stop above bull flag pivot NVDA 181. Stop 168.
Buy at 200 day SMA IBM 128. Stop 125.
Buy pullback into bullish hammer candle META 159. Stop 154.